Baltic inflow of December 2014
During the last decades, Major Baltic Inflows (MBI) became very seldom. However, after more than ten years without such an event, in December 2014 a strong MBI brought large amounts of saline, and well oxygenated water into the Baltic Sea. The inflow volume and the amount of salt transported into the Baltic were estimated with 198 km3 and 4 Gt, respectively. In the list of the MBI’s since 1880 this inflow is the third strongest event together with the MBI in 1913. It will most probably turn the entire Baltic deep water from anoxic to oxic conditions, with wide spread consequences for marine life and biogeochemical cycles. With a certain temporal delay, the changes will affect the surface waters, too.
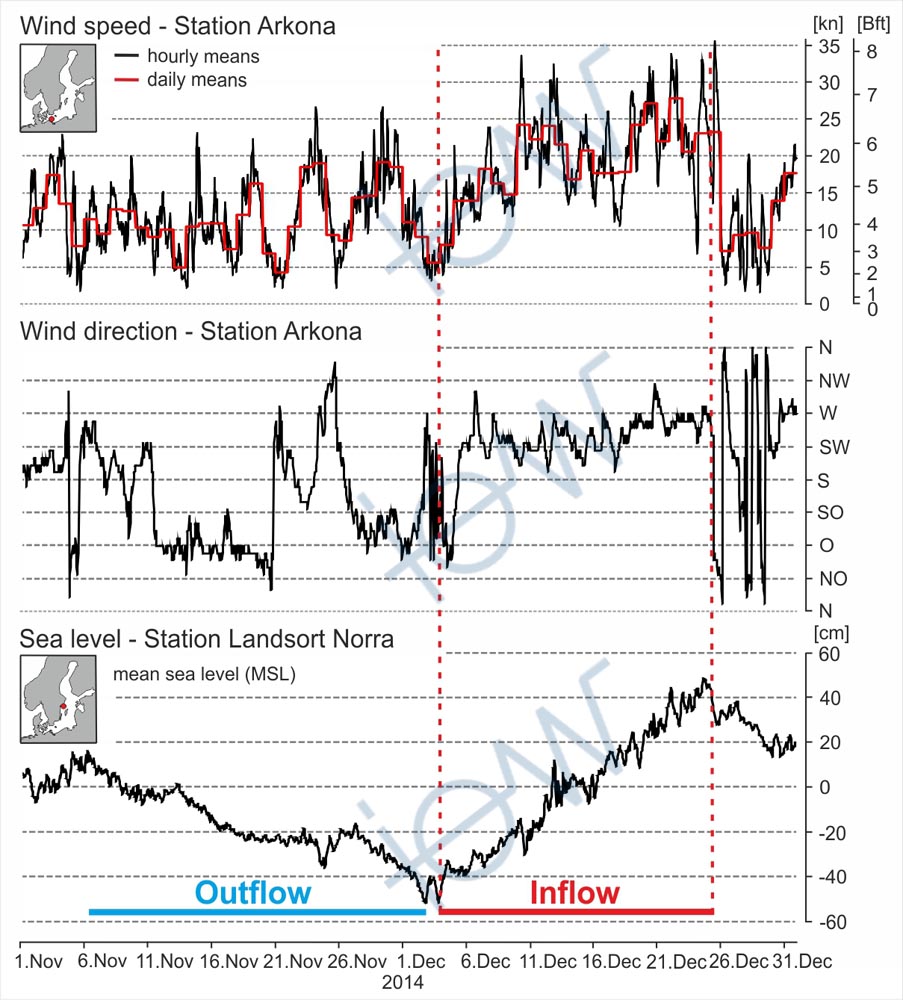
Due to a long lasting phase of easterly winds, the average water level of the Baltic Sea was considerably lowered in November. This was a perfect setting for the following inflow event. On December 3, at the Swedish gauge station Landsort Norra, which is representative for the average water level of the Baltic Sea, the lowest level of the year (-52 cm) was registered (Fig. 1).
During the following three week phase of strong westerly winds, the water masses from the Kattegat were pressed through the narrow straits of the Great Belt and the Öresound into the western Baltic Sea. The wind data measured at the station Arkona in the North of the Island Rügen (Fig. 1) depict the situation in the western Baltic Sea. The continuous wind forcing caused an increase of the average water level of the Baltic Sea by about one meter by December 26. This corresponds to a total inflow volume of about 320 km³.
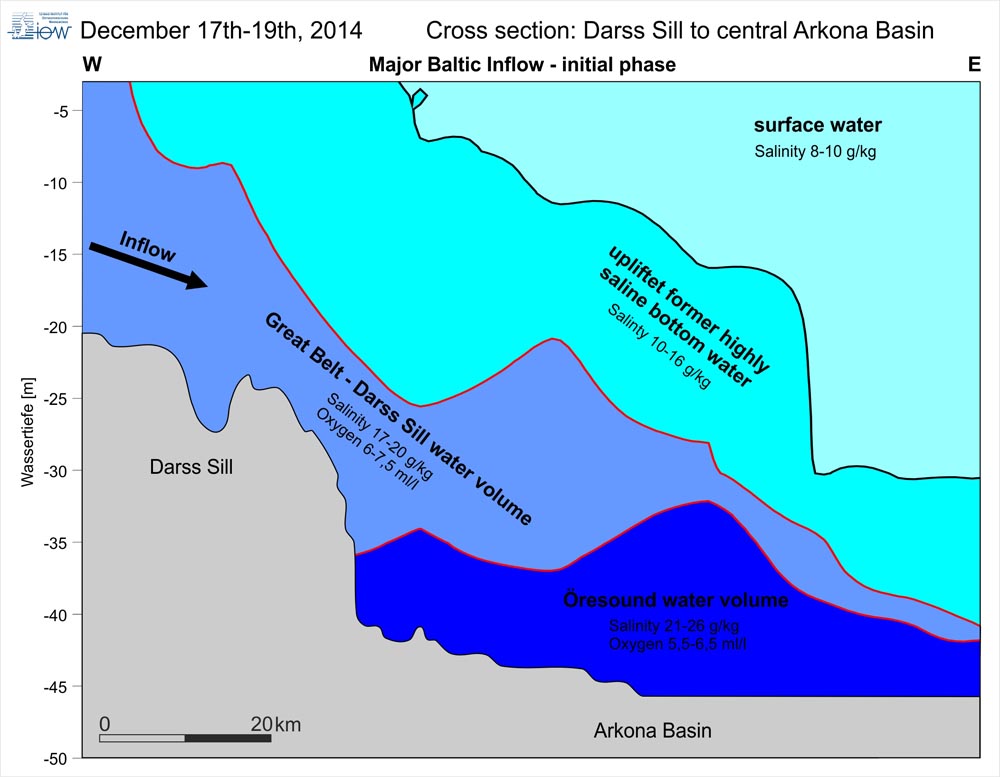
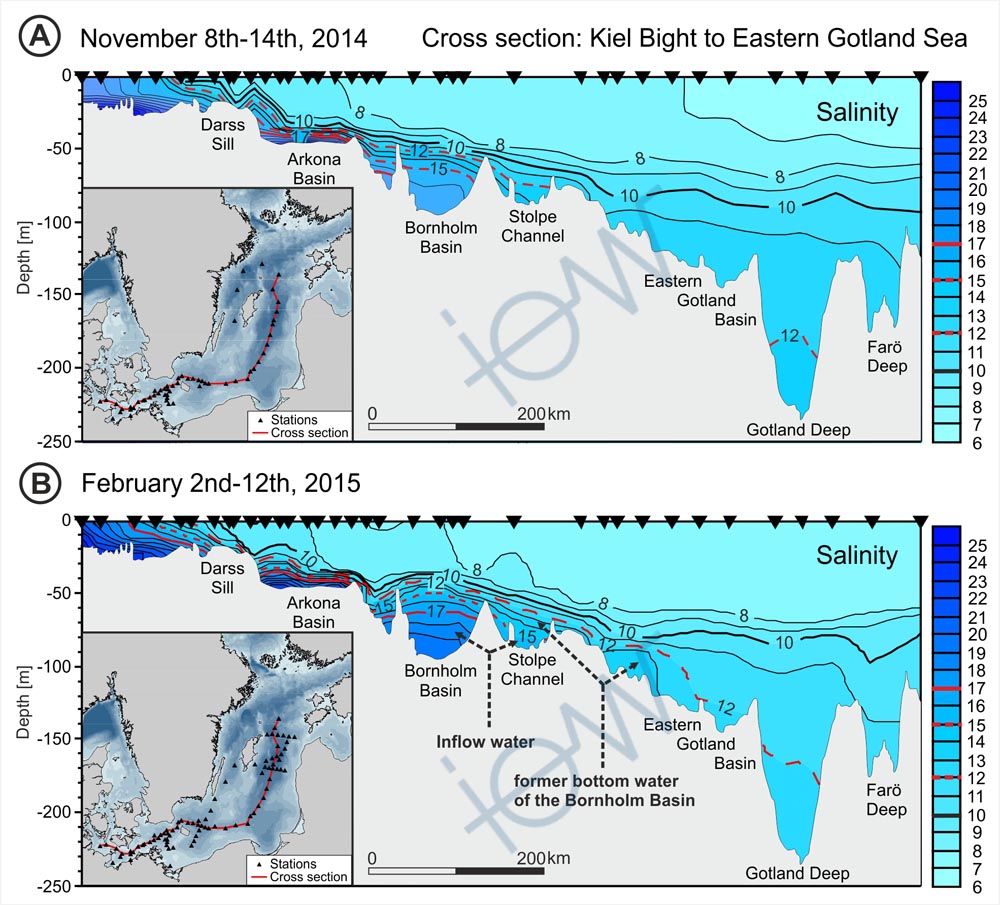
The share of salt-rich water which, due to its high density, is spreading at the sea floor amounts up to nearly 198 km³. After passing the shallow water areas of the western Baltic Sea (Darss Sill, Drogden Sill), these water masses are flowing eastwards into deeper areas. Figure 2 shows the situation in the Arkona Basin in the middle of December. At the bottom, salt-rich water with salt contents up 26 g/kg, which entered via the Öresound – the shortest connection with the Kattegat - is found. Above this layer, water with slightly lower salt values of up to 21 g/kg is found. It took the longer transport way from the Great Belt via the Darss Sill into the Arkona Basin and, thus, experienced stronger mixing with other water masses with lower salinity. Above this, the “old”, former bottom water of the Arkona Basin with salt values between 10 and 16 g/kg is found. It was lifted by the bottom-near inflowing “new” water masses.
| Rank | MBI | Salt [Gt] | Volume [km3] |
|---|---|---|---|
| 1 | November/December 1951 | 5.17 | 225 |
| 2 | December 1921/January 1922 | 5.12 | 258 |
| 3 | November/December 1913 | 3.80 | 174 |
| 3 | December 2014 | 3.98 | 198 |
| 4 | January 1993 | 3.40 | 159 |
| 5 | November/December 1897 | 3.35 | 177 |
| 25 | January 2003 | 2.03 | 97 |
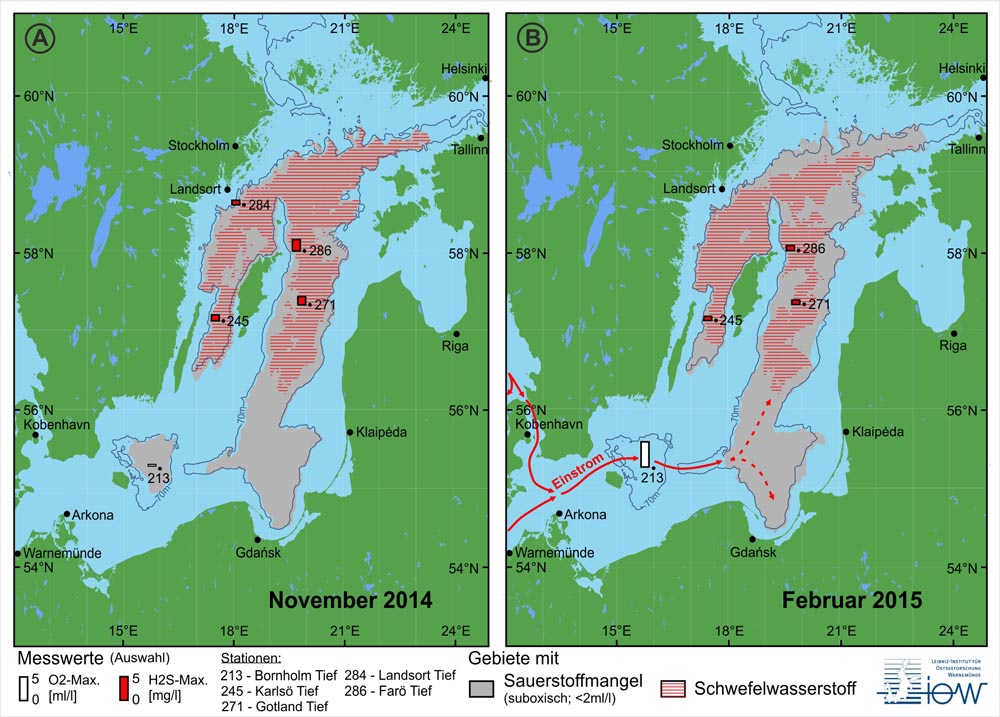
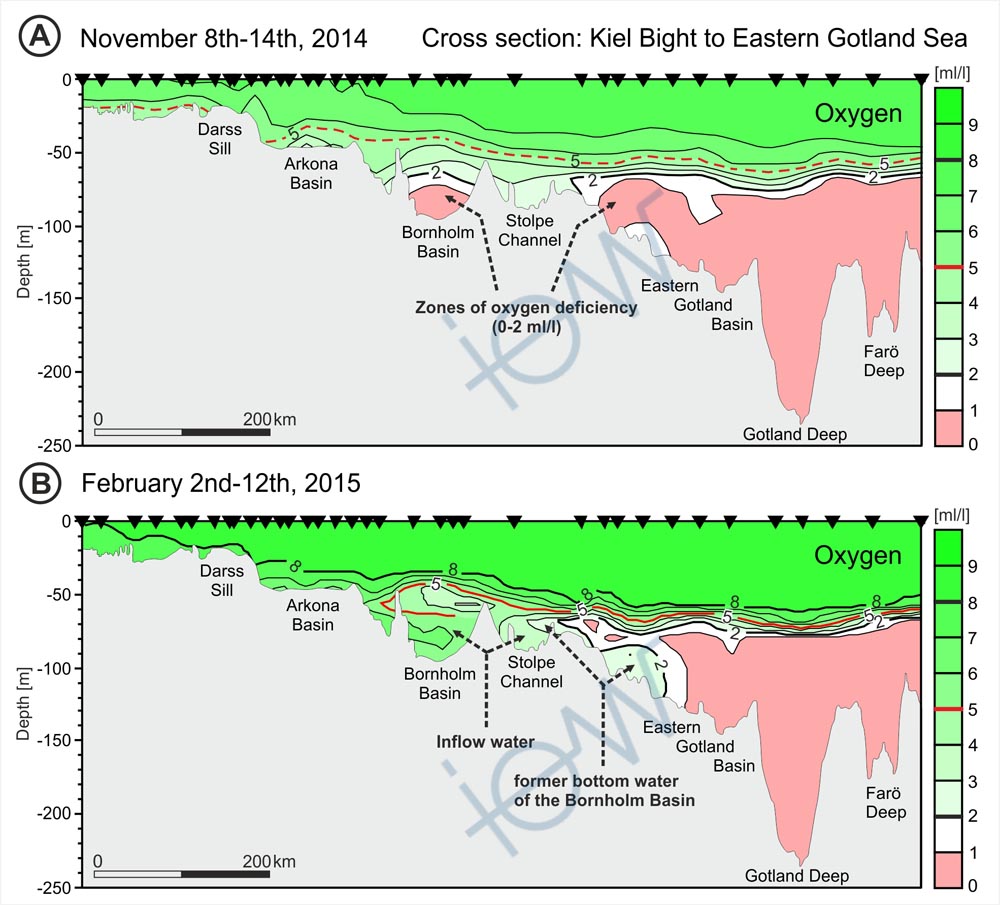
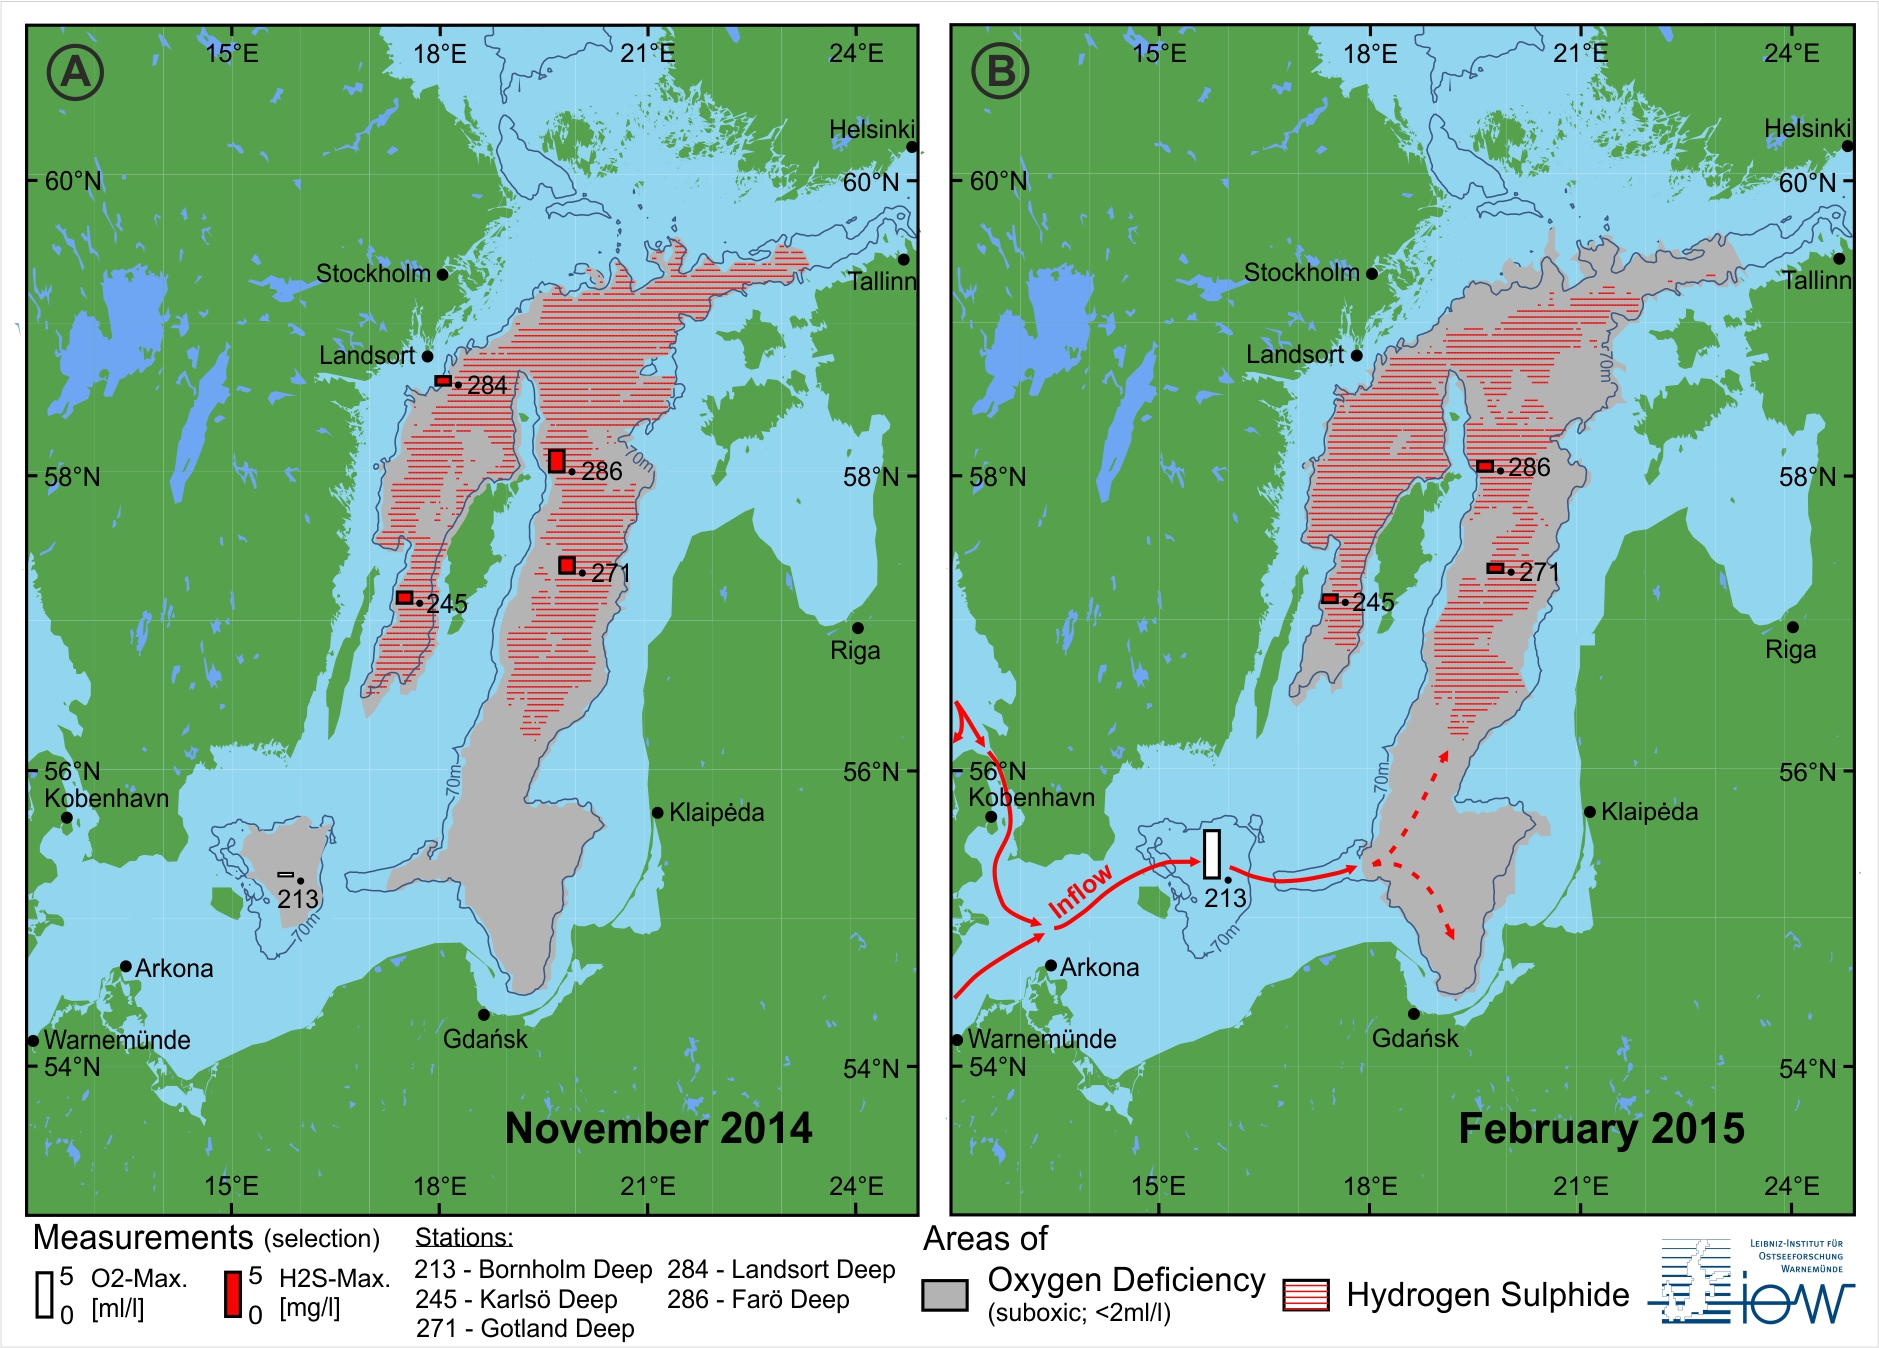
During the further course, the adjacent Bornholm Basin (up to -95 m water depth) was filled. Since the middle of January water with high salinity flows out of the Bornholm Basin passing the Stolpe Sill, which forms the last barrier before reaching the eastern Gotland Basin (up to -240 m water depth). In the first phase, the uplifted former bottom water of the Bornholm Basin, which contains lower oxygen concentrations of up to 2ml/l, gets pressed over the sill. Since February the “new” bottom water is passing this sill. As a consequence, salinity and oxygen concentration of the water masses, which flow into the Gotland Basin, are constantly rising. Figure 3 and figure 4 show both parameters along a transect from the Kiel Bight to the northern part of the Eastern Gotland Basin. In parallel, the situation of February 2015 (B) is compared with a pre-inflow situation from November 2014 (A). The rising salinity and oxygen concentration values in the deep water of an area from Arkona Basin to the southwestern part of the Gotland Basin clarify the dimension of the environmental change this event has triggered (Fig. 3 – B, Fig. 4 – B). Figure 5 shows a map of the spatial changes of the oxygen minimum zone (< 2ml/l) and areas of toxic hydrogen sulfide at the same dates as the profiles in Figs. 3 and 4.
Authors: Dr. Michael Naumann, Dr. Volker Mohrholz, Dr. Günther Nausch
Contact: Dr. Barbara Hentzsch
Leibniz Institute for Baltic Sea Research Warnemünde, February 2015
Publication
Mohrholz,V., Naumann, M., Nausch, G., Krüger, S., and U. Gräwe, 2015.
Fresh oxygen for the Baltic Sea – An exceptional saline inflow after a decade of stagnation. J. Mar. Sys. 2015,
dx.doi.org/10.1016/
j.jmarsys.2015.03.005
International Workshop
“Major Baltic Inflow (MBI) December 2014”, May 20, 2015 at the IOW.
The MBI workshop is intended to bring together institutions currently active with investigating the most recent salt water inflow and the consequences of this largest event since 1951 in order to identify gaps in measurements, to discuss joint publications and to discuss further research projects related to this event.
Documented Major Baltic Inflows
Figures
