How do spectrophotometric pH measurements work?
Spectrophotometric pH measurements are based on the addition of a pH-sensitive indicator dye to a water sample. One routinely used dye is m-Cresol purple (mCP), which we also investigated and used within PINBAL. Within the pH-range of seawater the dye changes its color from yellow to purple.
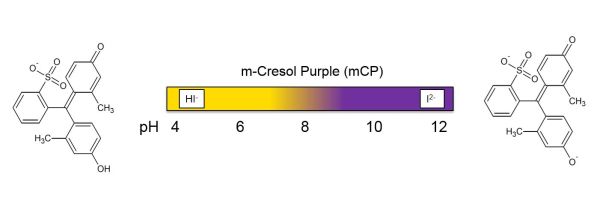
As the second dissociation constant pK2 of the diprotic dye mCP is in the pH range typical for seawater, the pH of the solution can be expressed as:
|
(1) |
where [HI-] and [I2-] are the concentrations of the monoprotonated and deprotonated species of the indicator dye, respectively. The concentration ratio [HI-] / [I2-] is determined by absorbance (A) measurements, which in general relate the light intensity recorded for the blank (I0) to the light intensities recorded for the sample solution (I):
|
(2) |
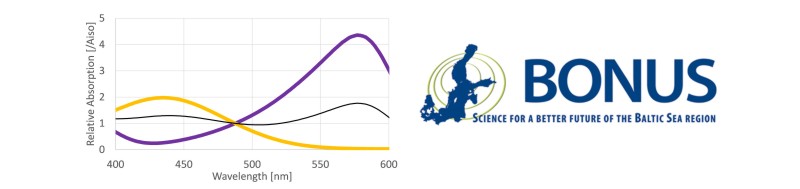
HI- and I2- have two clearly distinguishable absorbance maxima at wavelength λ1 = 434 nm and λ2 = 578 nm, respectively (Clayton and Byrne 1993). However, the absorbance spectra of both indicator species overlap. Therefore, at both wavelength λ1 and λ2 the absorbance Aλ needs to be expressed by the Lambert-Beer-law describing the additive absorbance contribution of both indicator species as:
|
(3) |
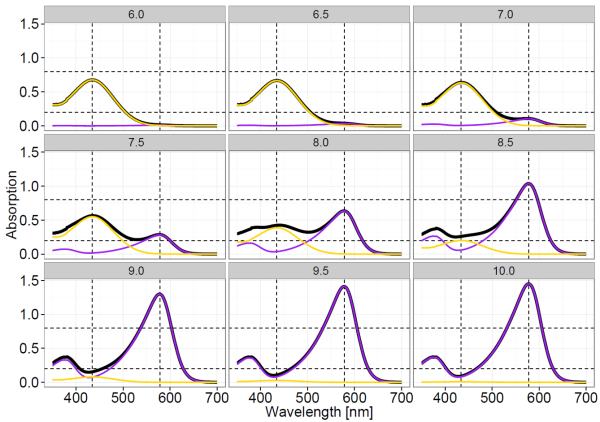
where ελ(X) are the molar extinction coefficients of the indicator species X at wavelength λ, and d is the cuvette length. Illustrative absorption spectra of mCP at a range of pH levels are illustrated below.
Combining the equations 1 and 3, and algebraic manipulation allow to express the pH of the solution as:
|
(4) |
where R = A578 / A434 is the ratio of the absorbance measured at the two peak wavelengths and e1 = ε578(HI‑) / ε434(HI‑), e2 = ε578(I2‑) / ε434(HI‑) and e3 = ε434(I2‑) / ε434(HI‑) are the molar absorptivity ratios (Clayton and Byrne 1993).
The coefficients in Eq. 4 were determined in several studies, for a range of salinity and temperature conditions (see Mosley et al. 2004; Liu 2011; Lai et al. 2016).
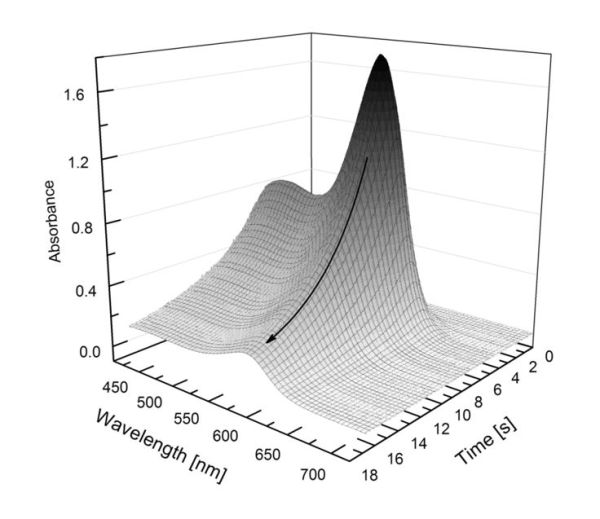
The pH measurement system developed within PINBAL is a continued development of the flow injection analysis (FIA) approach described by Aßmann et al. (2011). The overall measurement principle of the instrument is based on the injection of a mCP stock solution into a continuous sample flow. After the injection of the dye a concentration peak passes the cuvette and the backward flank of the dilution curve is continuously recorded resulting in more than 100 absorbance spectra per single pH measurement. The pH-perturbation caused by the dye addition can be corrected by extrapolating the pH values calculated from each spectrum to zero absorbance at the isosbestic wavelength, which is a directly related to the dye concentration. For the absorbance measurements the system is equipped with a VIS broadband LED as light source and a CCD spectrometer as detector (see Aßmann et al. 2011 for details).
References
Aßmann, S., C. Frank, and A. Körtzinger. 2011. Spectrophotometric high-precision seawater pH determination for use in underway measuring systems. Ocean Sci. 7: 597–607. doi:10.5194/os-7-597-2011
Clayton, T. D., and R. H. Byrne. 1993. Spectrophotometric seawater pH measurements : total hydrogen results. Deep Sea Res. Part I Oceanogr. Res. Pap. 40: 2115–2129.
Lai, C.-Z., M. D. DeGrandpre, B. D. Wasser, and others. 2016. Spectrophotometric measurement of freshwater pH with purified meta-cresol purple and phenol red. Limnol. Oceanogr. Methods. doi:10.1002/lom3.10137
Liu, X. 2011. Purification and characterization of meta-cresol purple for spectrophotometric seawater pH measurements. Environ. Sci. Technol. 45: 4862–8. doi:10.1021/es200665d
Mosley, L. M., S. L. G. Husheer, and K. a. Hunter. 2004. Spectrophotometric pH measurement in estuaries using thymol blue and m-cresol purple. Mar. Chem. 91: 175–186. doi:10.1016/j.marchem.2004.06.008