
Time schedule and working programme
Timeline / Gantt chart
The Gantt chart indicates the timeline of ECODRIVE including the various workpackages, milestones (M) and deliverables (D).
Flow and processing of information
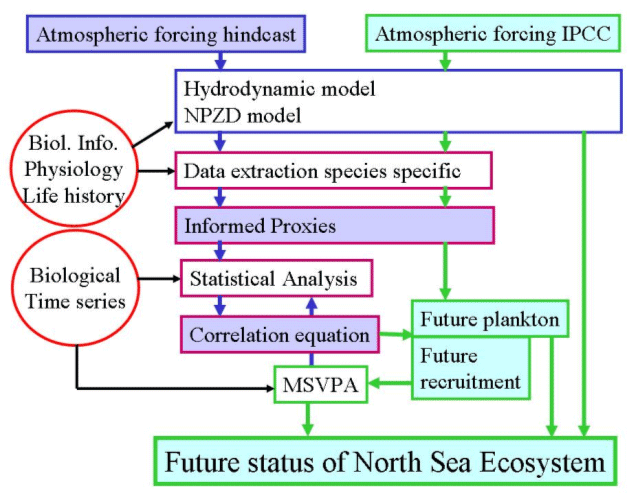
Blue arrows connecting boxes on the right side of the graph represent the flow of information in the hind-cast part of the analysis, while the green arrows represent the flow in the forecast mode. The colour of the frames matches the colours in the WP-overview: WP1 (system description) = Red, WP2 (System modelling) = Blue, WP3 (Past and present responses)= purple and WP4 (Future scenarios) = green. MSVPA is a multi-species population model run in forecast mode (e.g. SMS).