Hypoxic and anoxic regions in the Baltic Sea, 2016
The content of this webpage is additional content for the Marine Science Report No 100 2016 and should be cited as:
Susanne Feistel, Rainer Feistel, Dietwart Nehring, Wolfgang Matthäus, Günther Nausch, Michael Naumann: Hypoxic and anoxic regions in the Baltic Sea, 1969 - 2015. Meereswiss. Ber., Warnemünde, 100 (2016) doi: 10.12754/msr-2016-0100

This work is licensed under a Creative Commons Attribution-NonCommercial 4.0 International License.
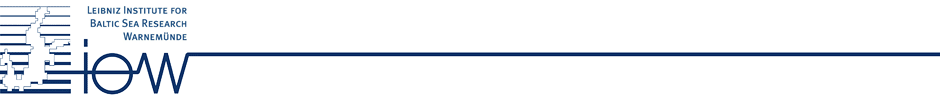
Jan/Feb, 2016: download SVG (computed 2016)
|
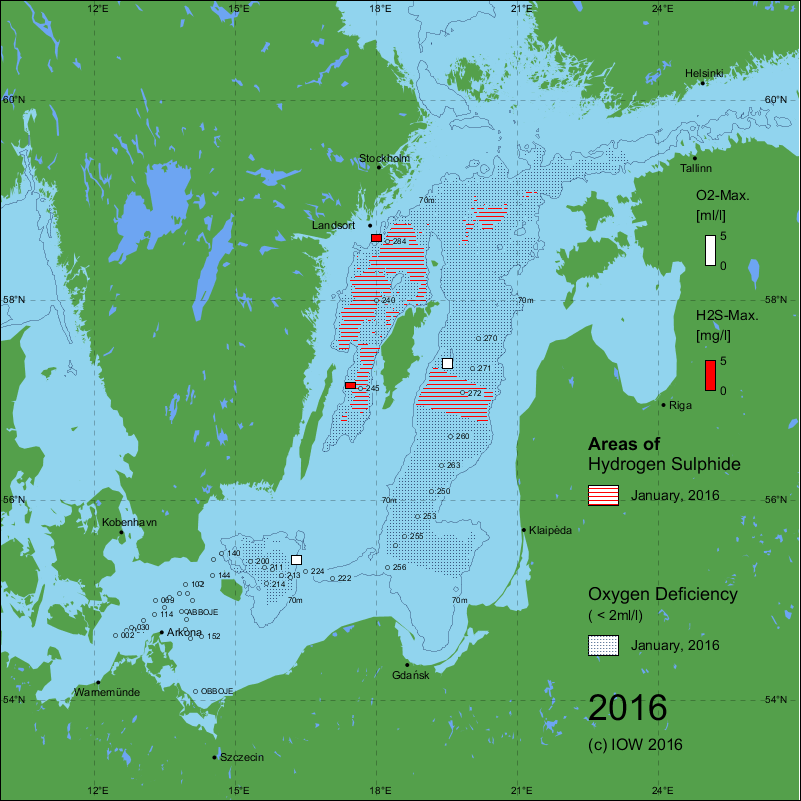
Mar/Apr, 2016: download SVG (computed 2016)
|
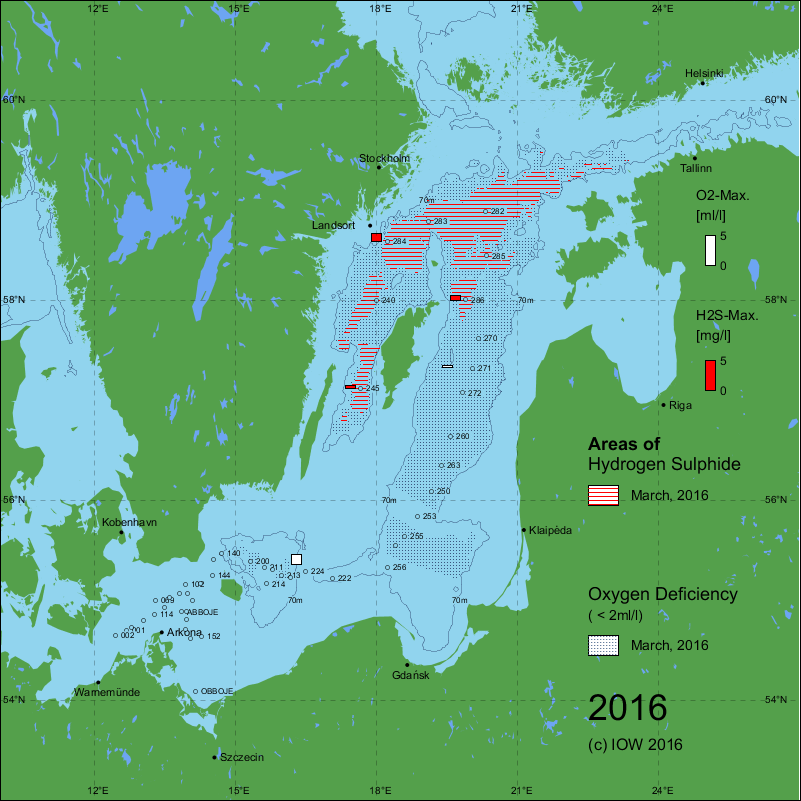
Apr/May, 2016: download SVG (computed 2016)
|
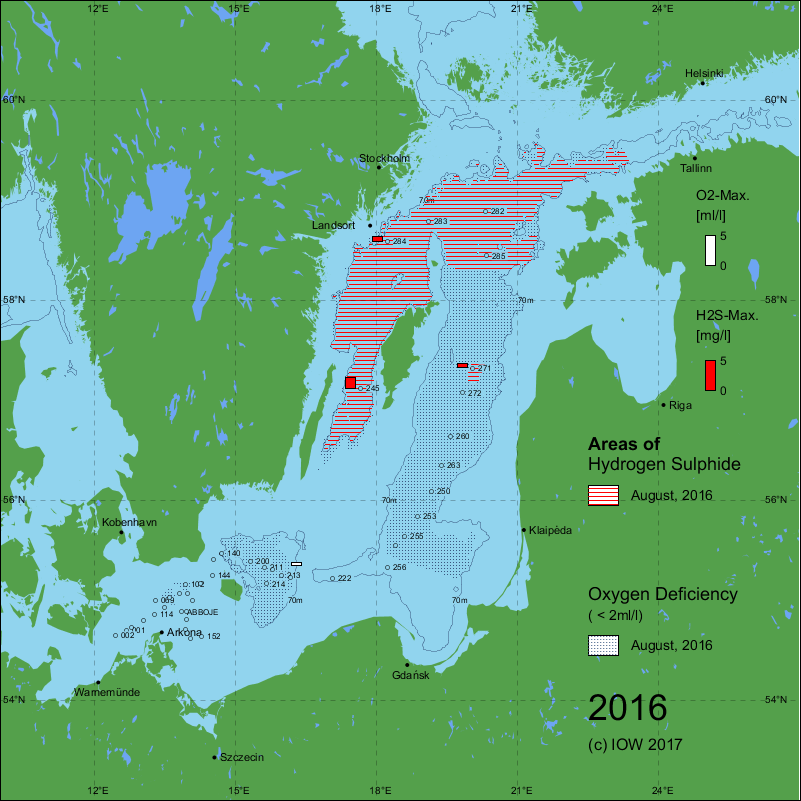
Jul/Aug, 2016: download SVG (computed 2017)
|
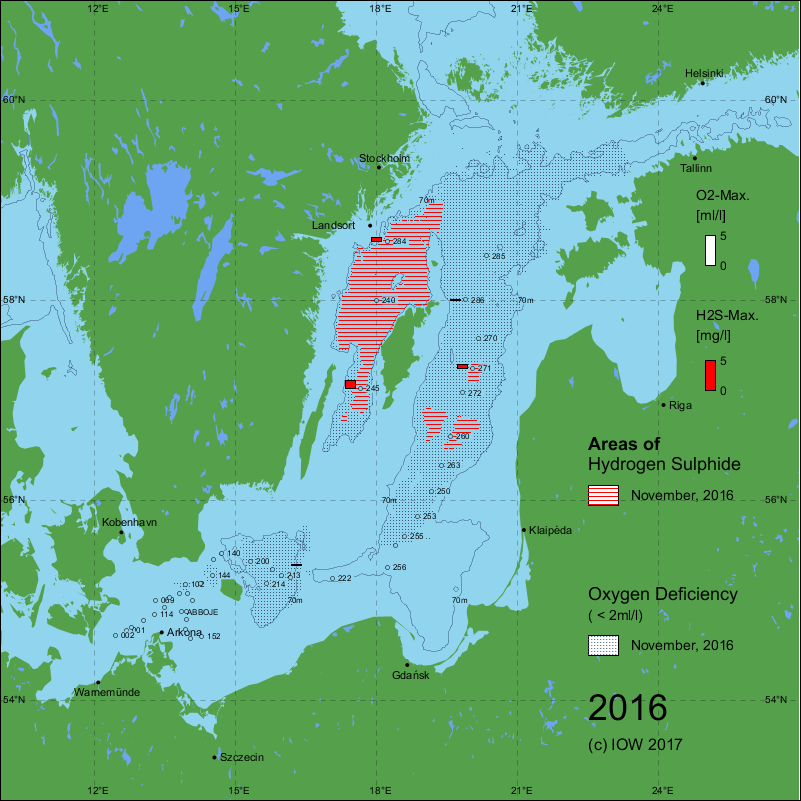
Oct/Nov, 2016: download SVG (computed 2017)
|
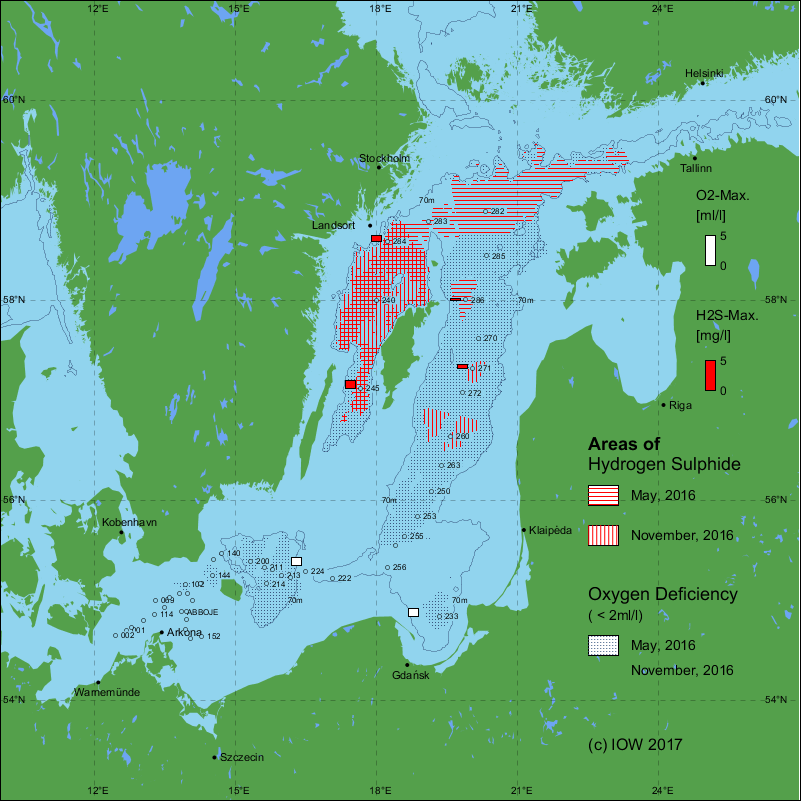
Apr/May & Oct/Nov, 2016: download SVG (computed 2017)
|
| Distribution maps for 2016. Ongoing inflow activity after the very strong event of December 2014 affected the oxygen conditions in the deep-water during the year. The moderate MBI’s of November 2015 (1.5 Gt salt transport, 76 km³ saline water volume) and January-February 2016 (1.6 Gt, 82 km³) reached the eastern Gotland Basin. In the end of January the November event caused an improvement of dissolved oxygen near-bottom at the Gotland Deep from 0.22 ml/l (November 2015) to 1.7 ml/l and salinity increased further to record-high values of 13.8 g/kg. The following January-February event didn’t reach the seafloor in this central area because of its lower salinity, but ventilated the midwater between 120-220 m since April. Afterwards oxygen depleted quickly in the central deep-water and hydrogen sulphide was found again in August. (NAUMANN et al., 2017). | |
References:
- NAUMANN, M., UMLAUF, L., MOHRHOLZ, V., KUSS, J., SIEGEL, H., WANIEK, J., SCHULZ-BULL, D., 2017: Hydrographichydrochemical assessment of the Baltic Sea 2017. – Meereswiss. Ber., Warnemünde, 104, doi: 10.12754/msr-2017-0104