
Suboxic and anoxic regions in the Baltic Sea deep waters
Due to the restricted water exchange with the North Sea and the permanent haline stratification in the central Baltic Sea, stagnation periods occur regularly in the deep basins. Stagnation periods are characterized by the depletion of nitrate, increasing phosphate and ammonium concentrations and decreasing salinity and oxygen content in the deep water, sometimes culminating in the formation of considerable hydrogen sulphide concentrations. A renewing of the deep water can only take place by extreme inflow events into the Baltic Sea - termed major Baltic inflows - which transport salt and oxygen rich water into the deep basins.
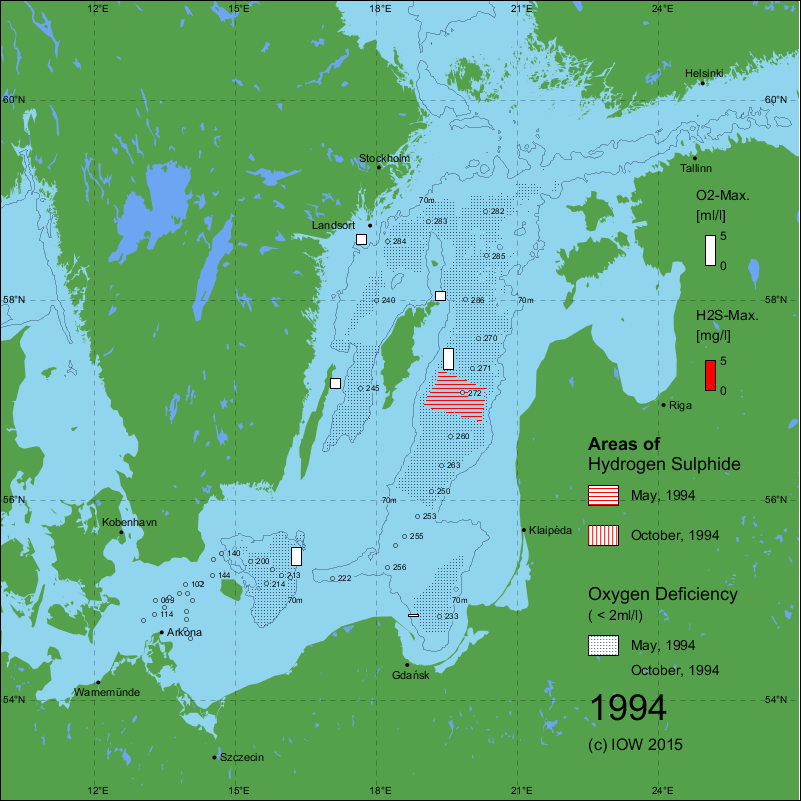
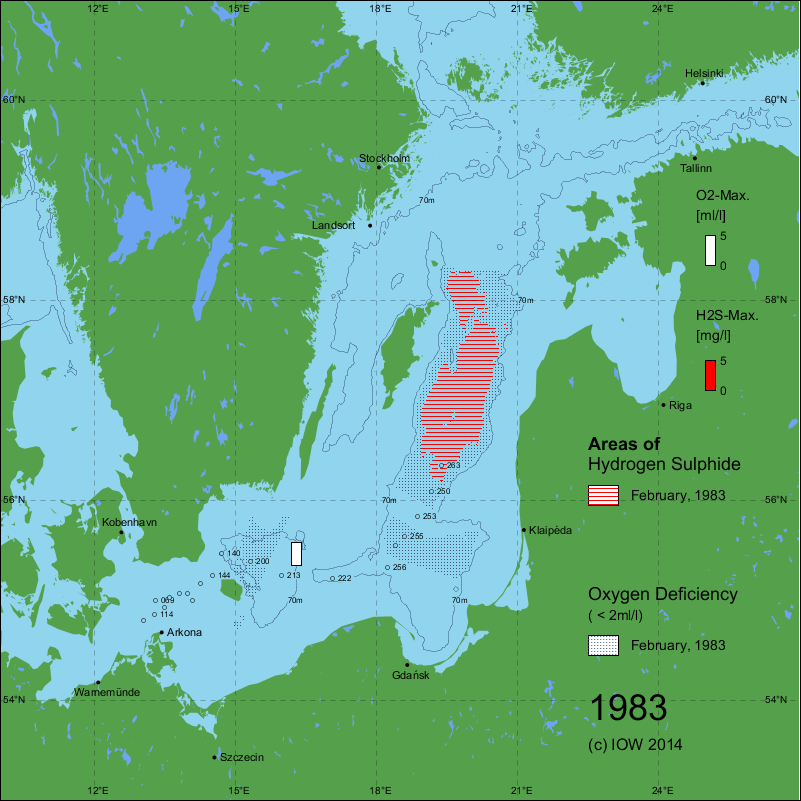
During the first three quarters of the last century these major inflows were recorded more or less regularly. Since the mid-1970s, their frequency and intensity have decreased.The longest stagnation period ever recorded lasted from the beginning of 1983 until the end of 1992 and was terminated by the very strong single inflow event in January 1993 and subsequent smaller inflows in winter 1993/1994. For the first time since 1977 the deep water in the whole Baltic Sea was oxic whereby oxygen reached highest concentrations in the Gotland Deep area since 1930s.
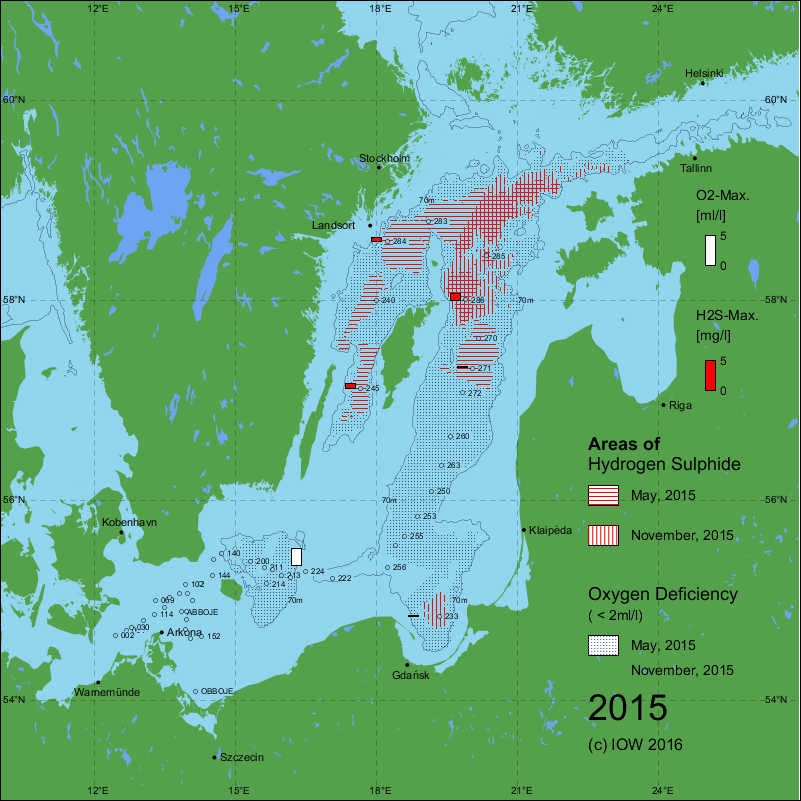
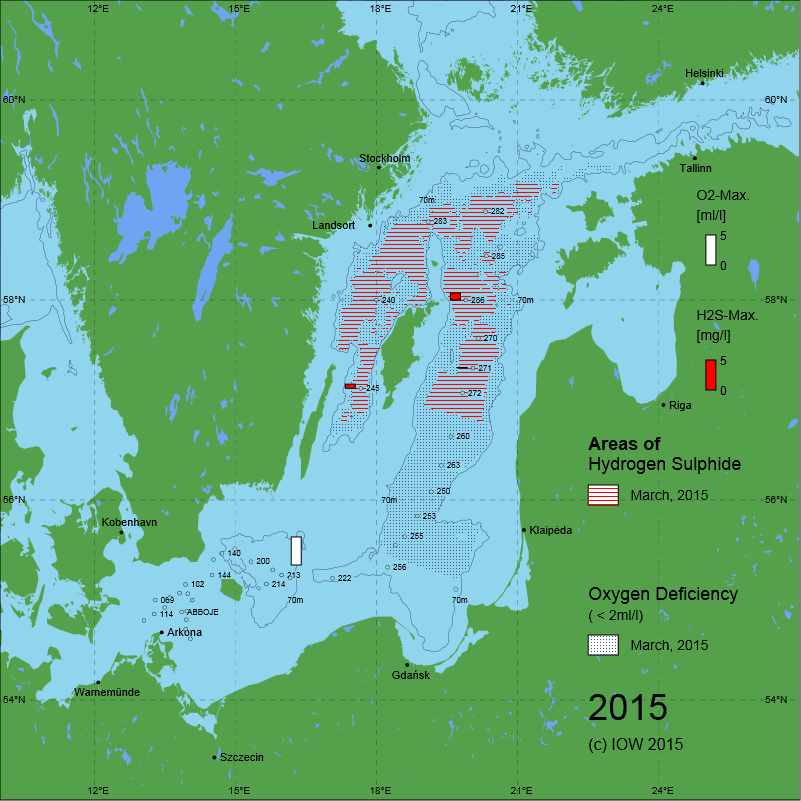
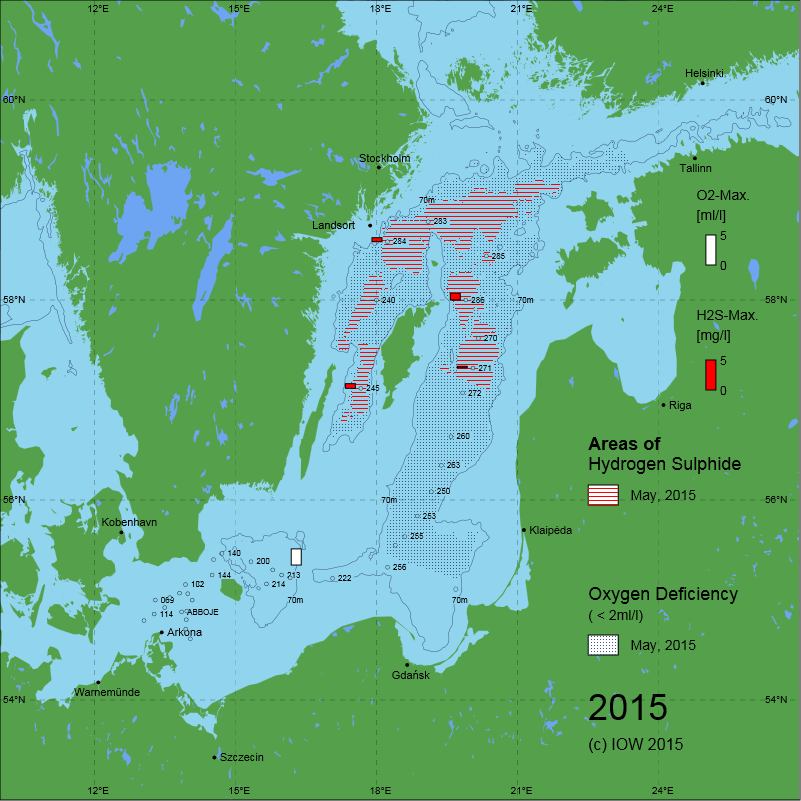
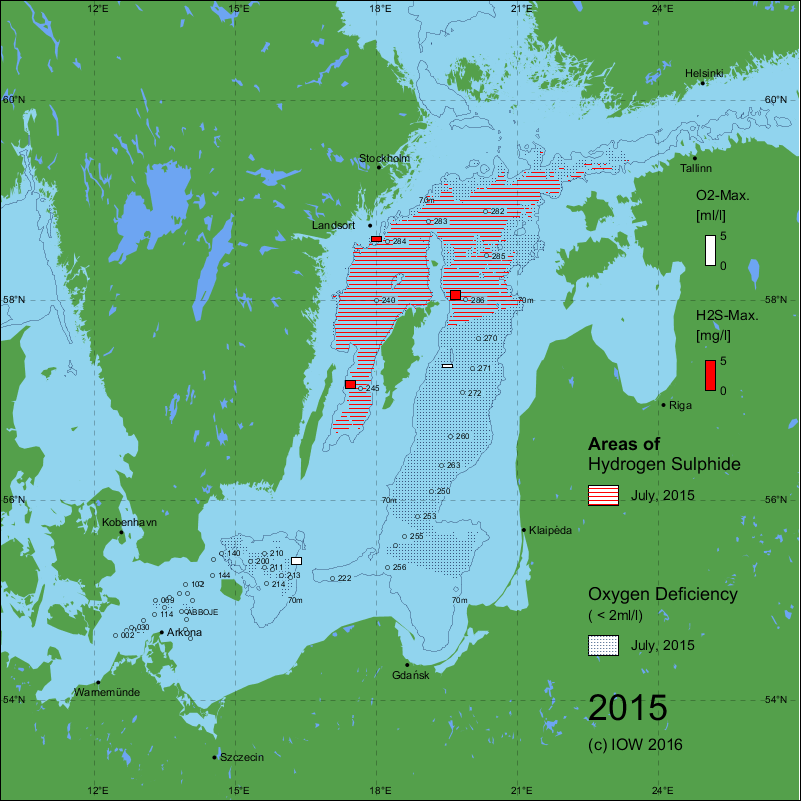
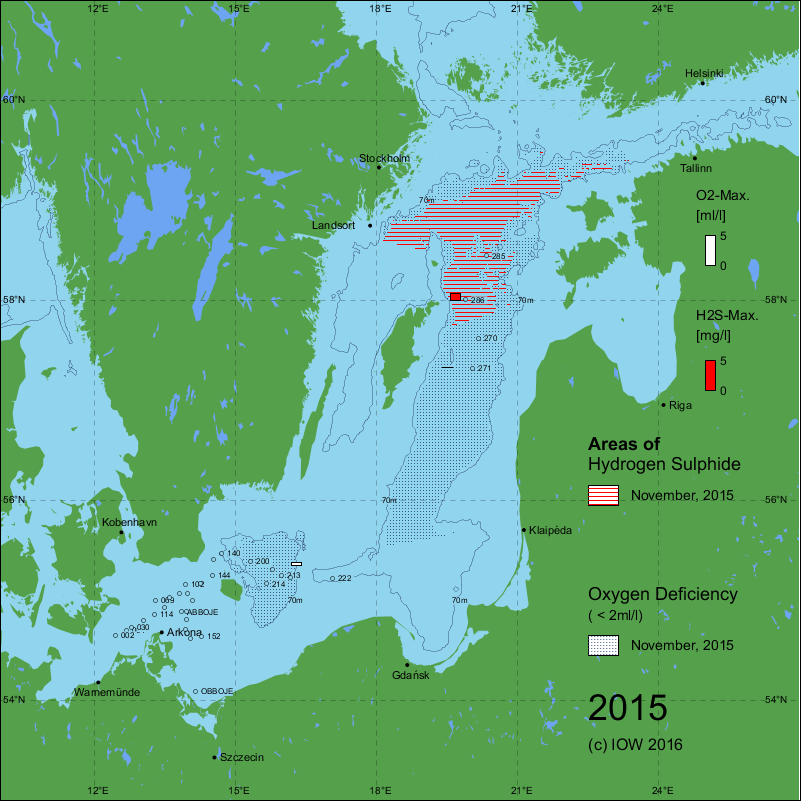
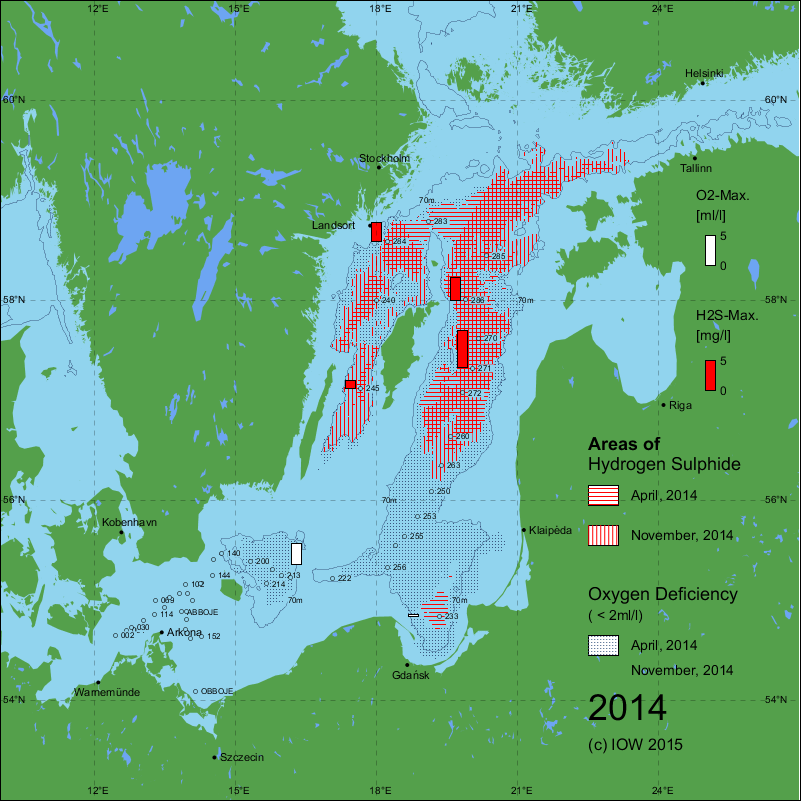
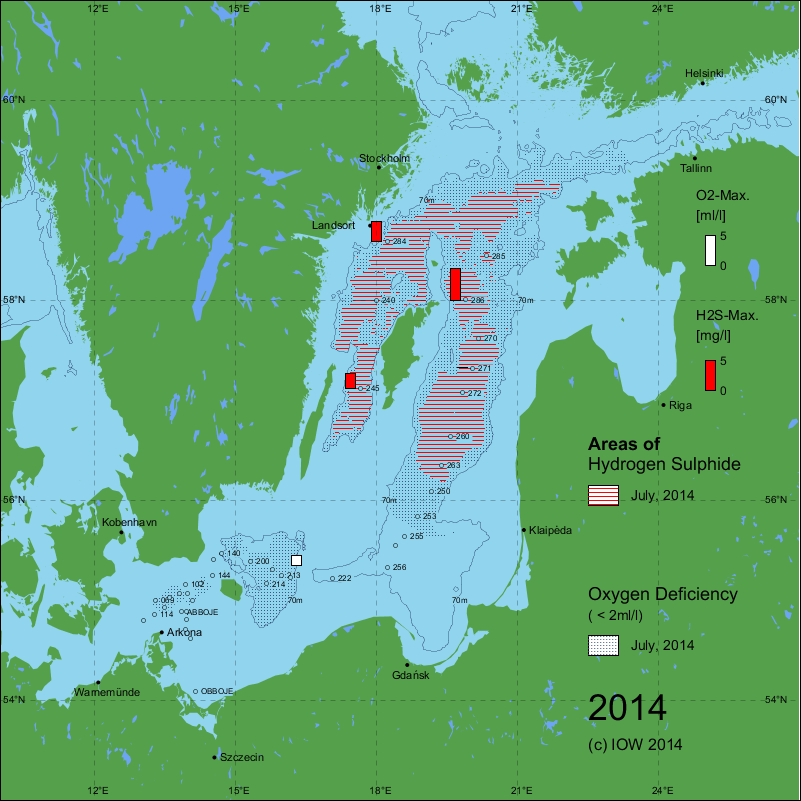
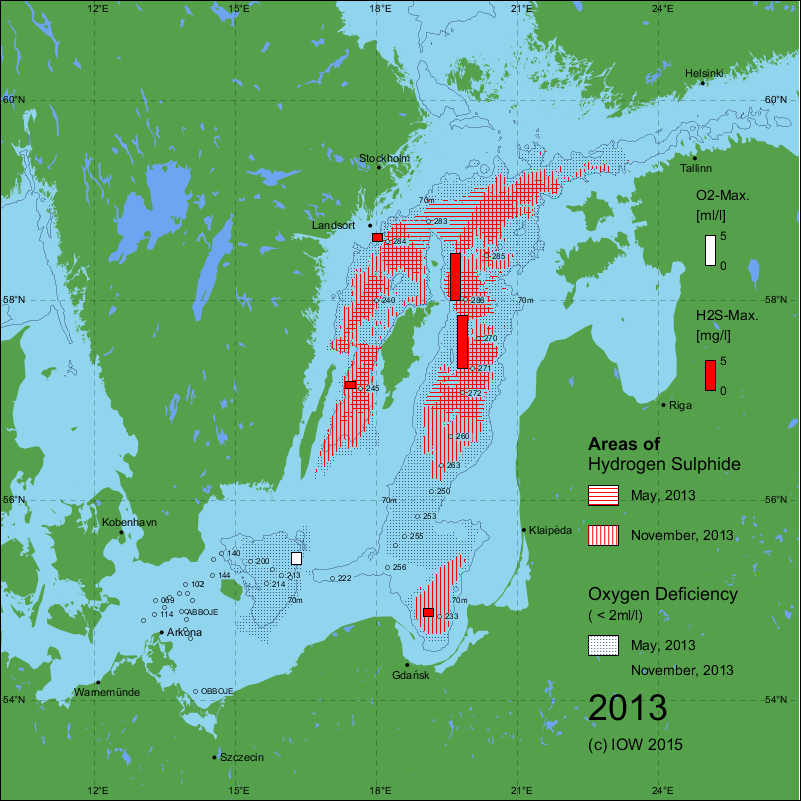
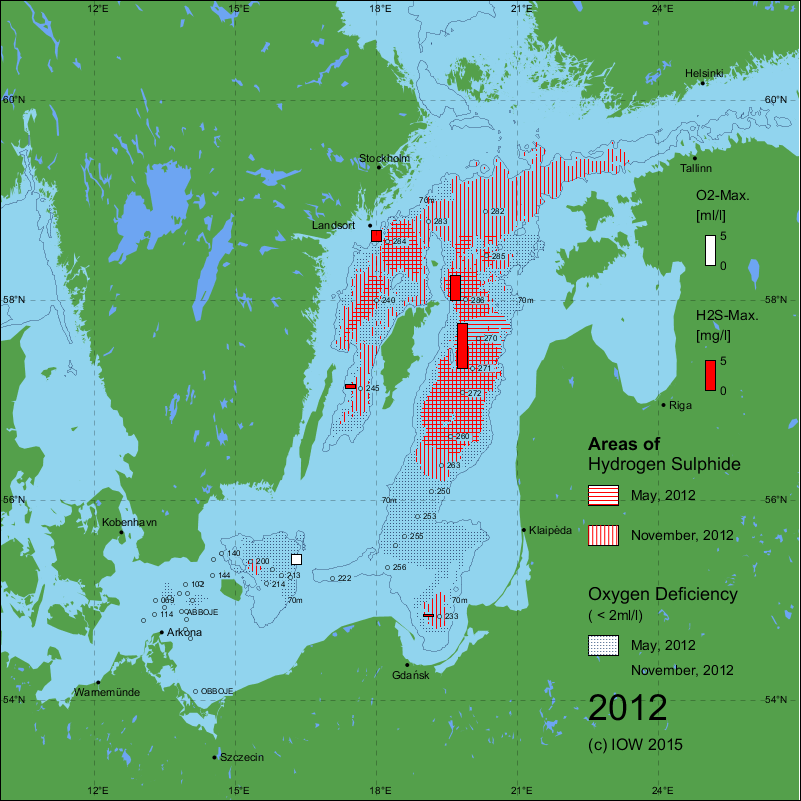
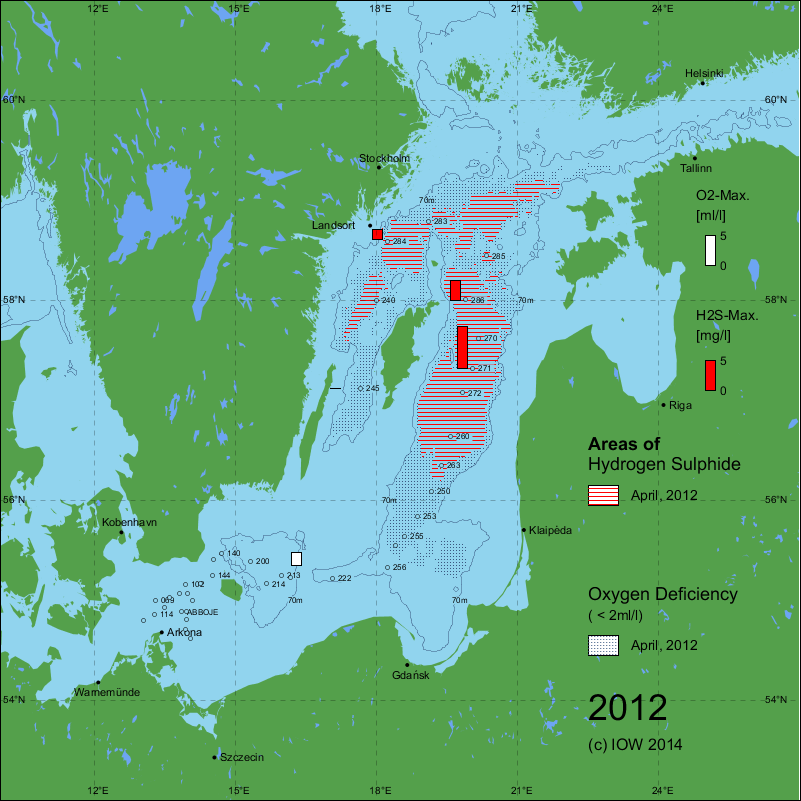
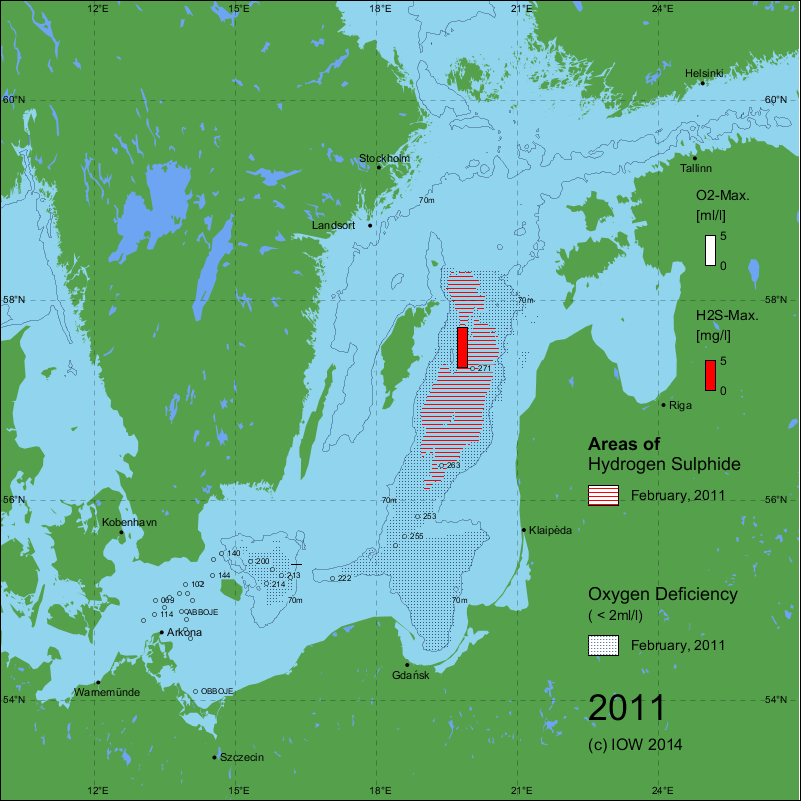
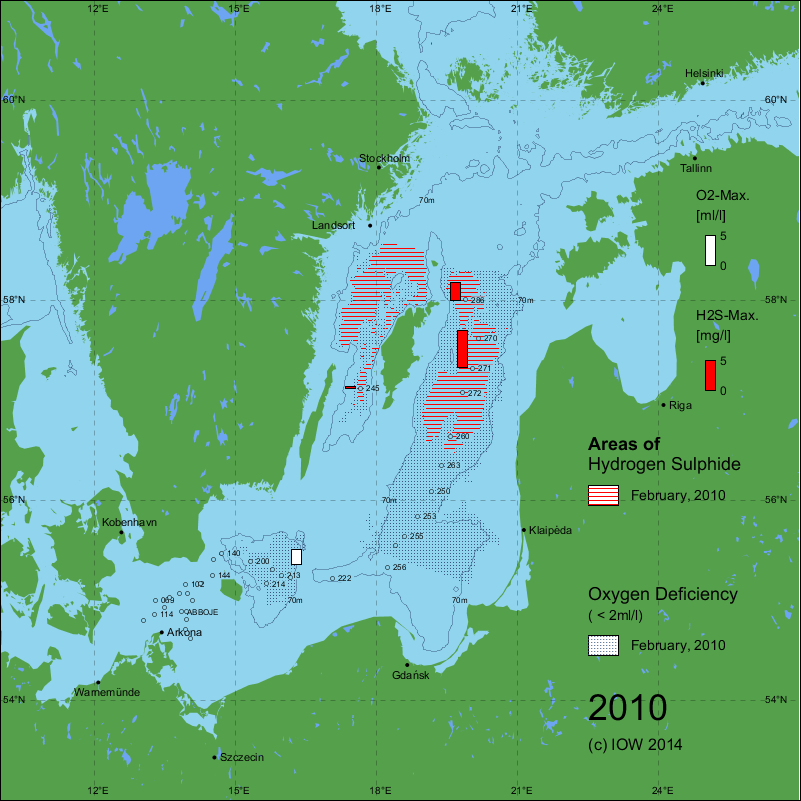
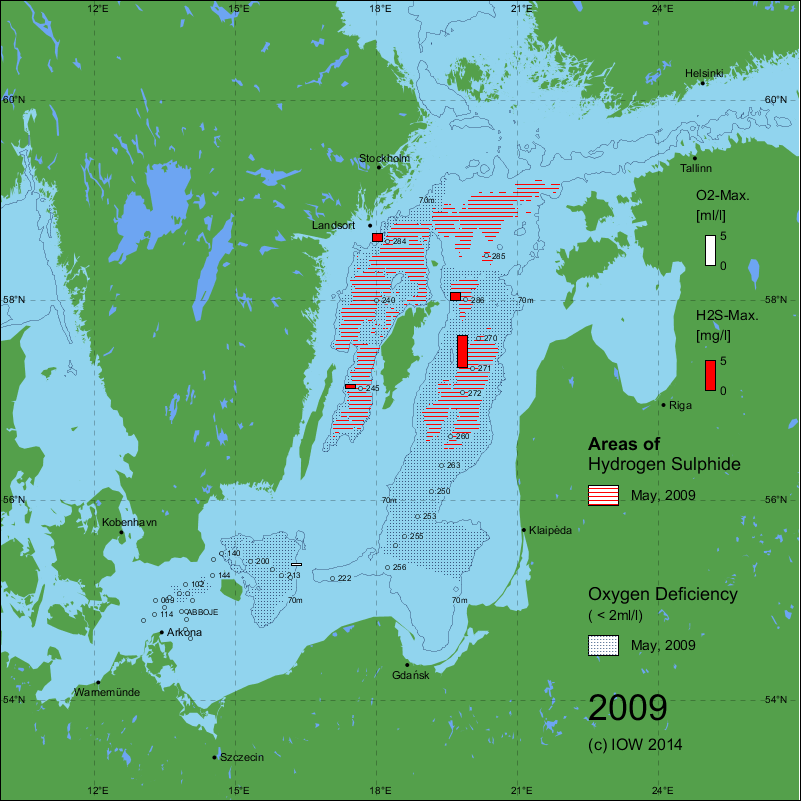
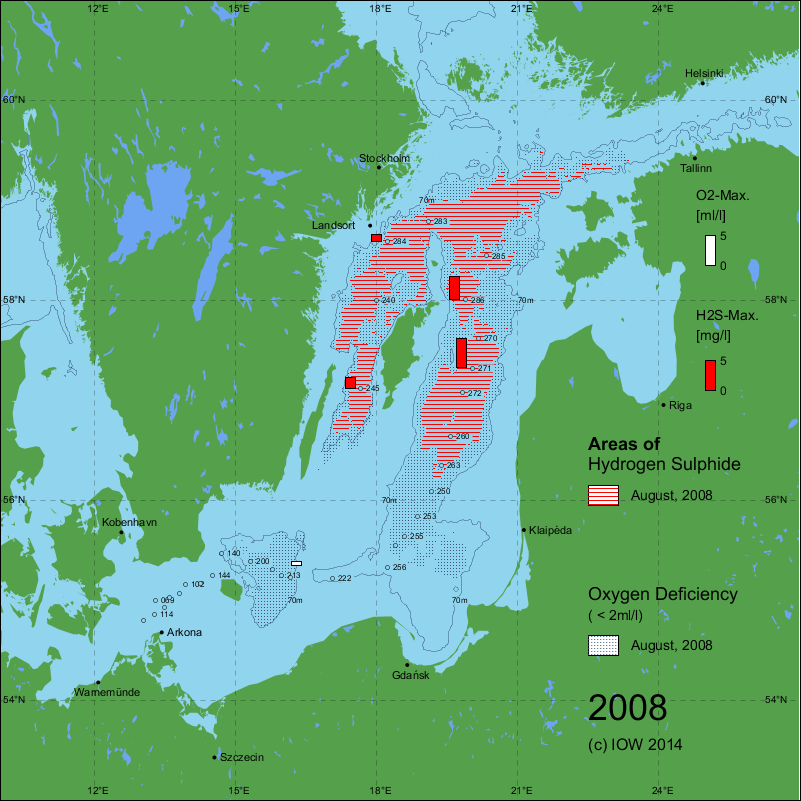
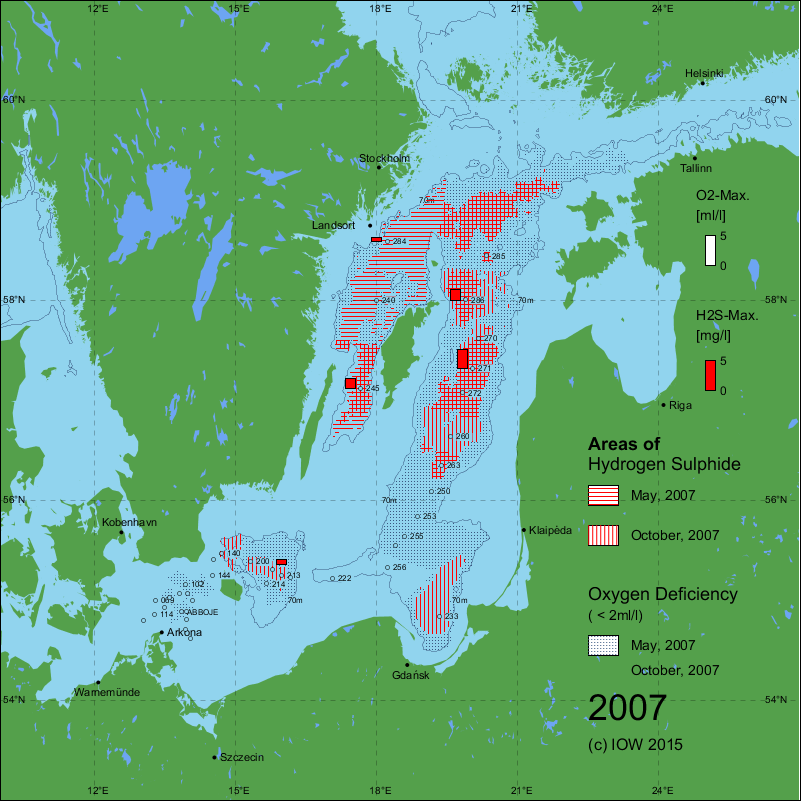
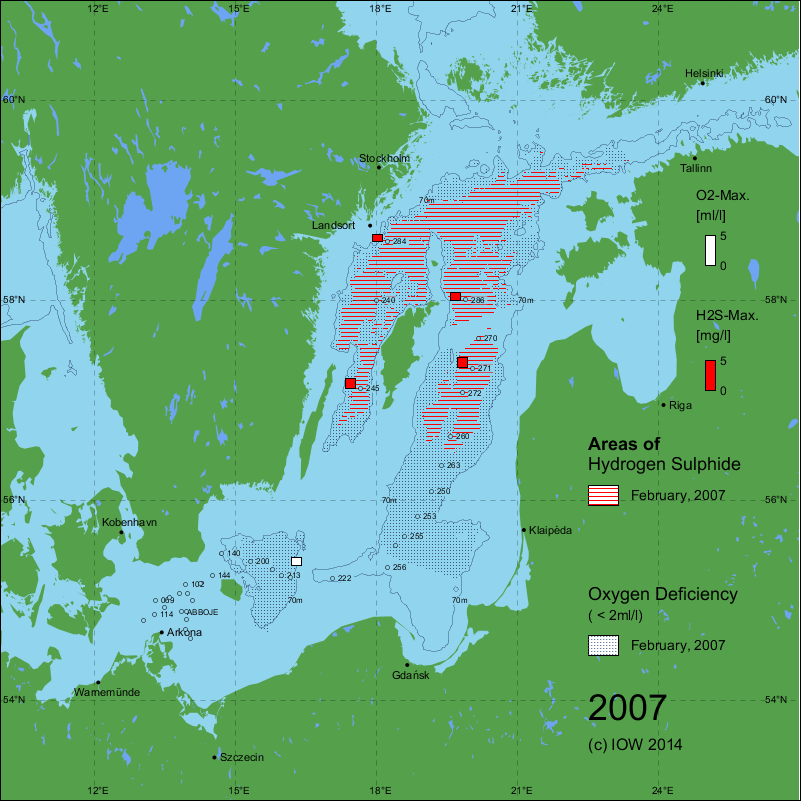
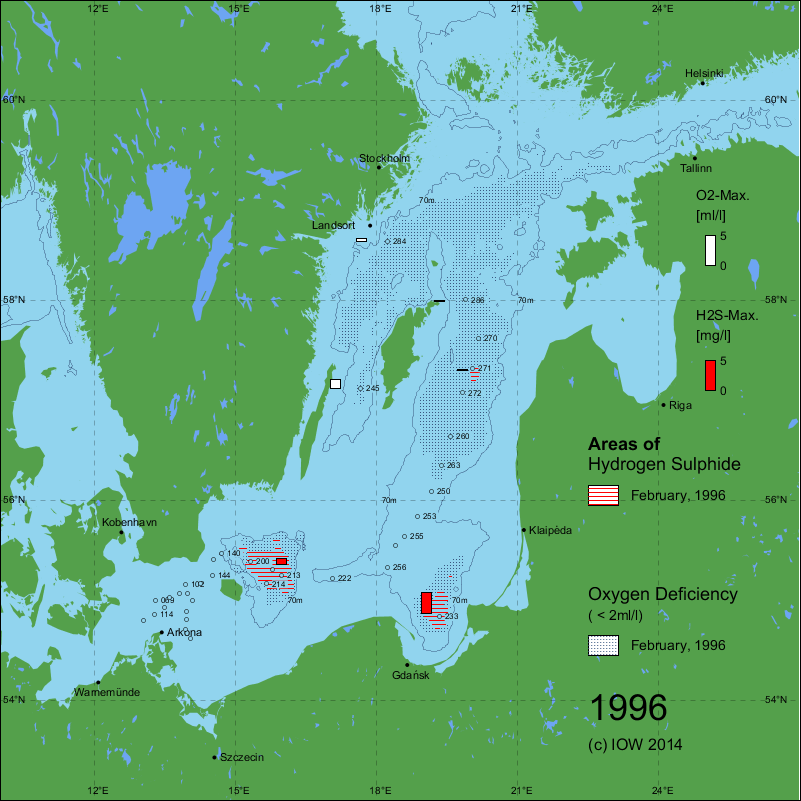
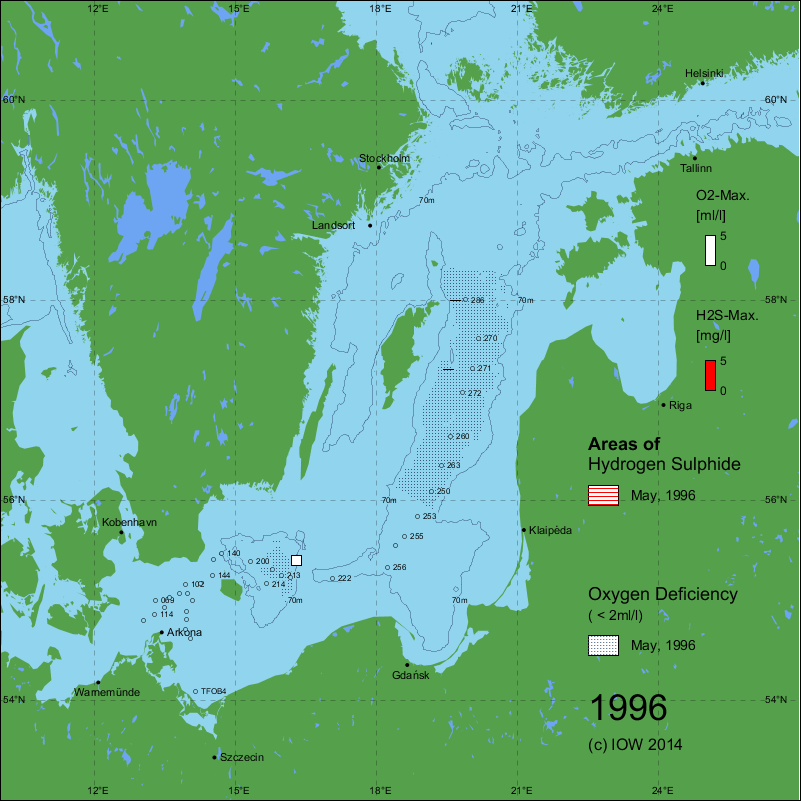
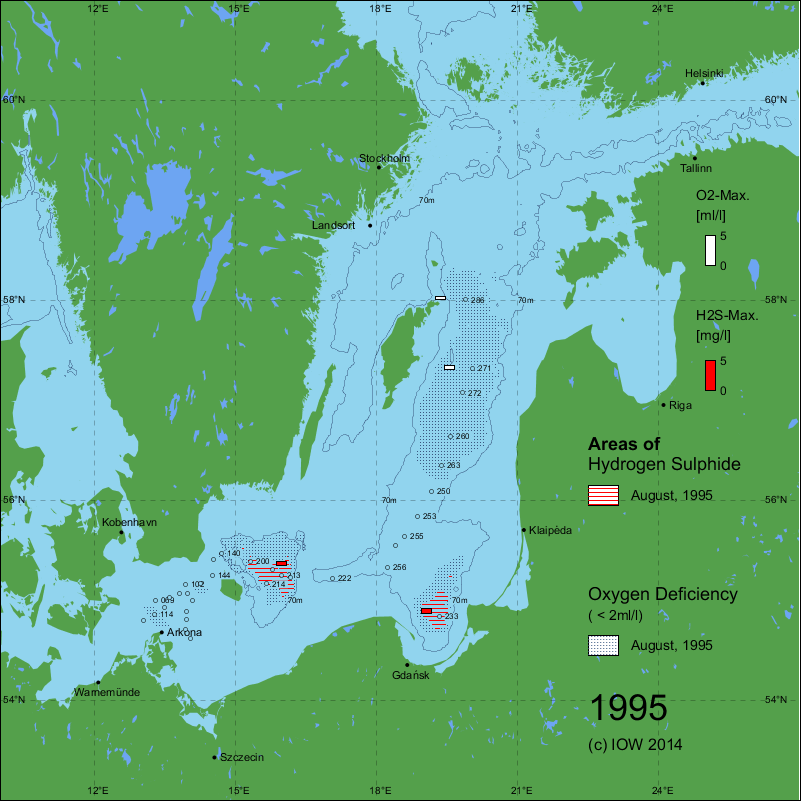
As can be seen in the following graphs a new stagnation period had started in 1995 which continued until the Major Baltic Inflow in 2003. A moderate inflow event in 2011 was able to ventilate the Bornholm and Gdansk Basin whereas the eastern Gotland Basin remained anoxic. Only in 2014, oxygen could be masured in the bottom water of the central station 271 in that basin. One of the strongest Major Baltic Inflows ever observed was registered in December 2014. Remarkable effects in the central Baltic Sea will be expected in 2015.
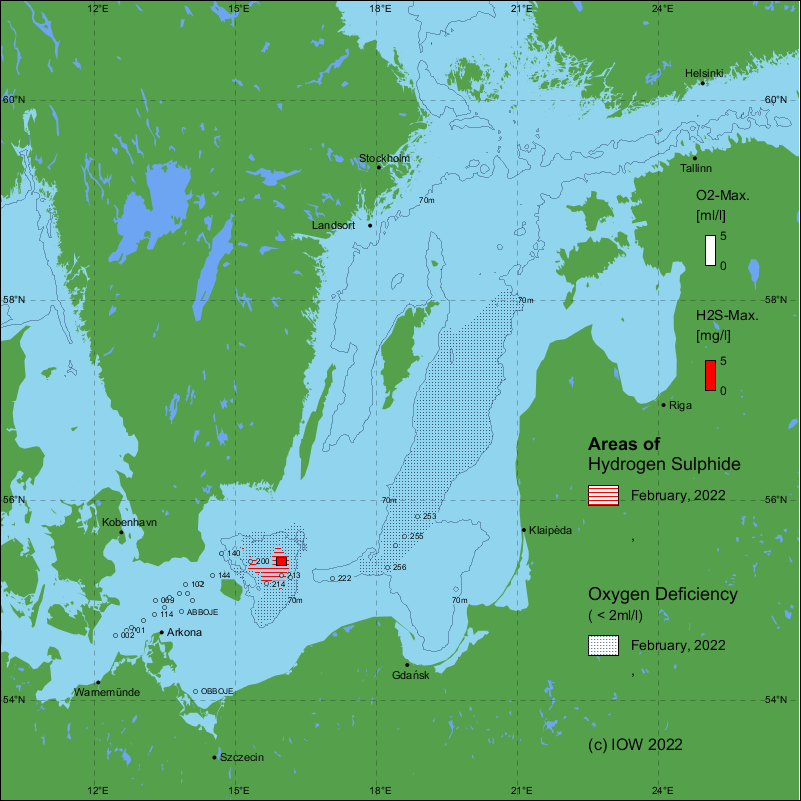
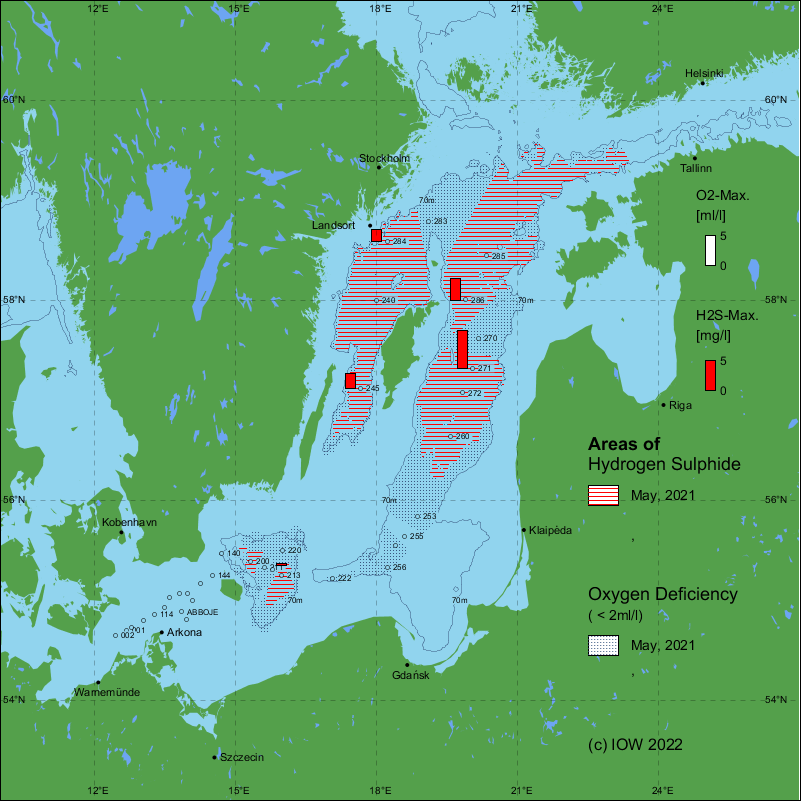
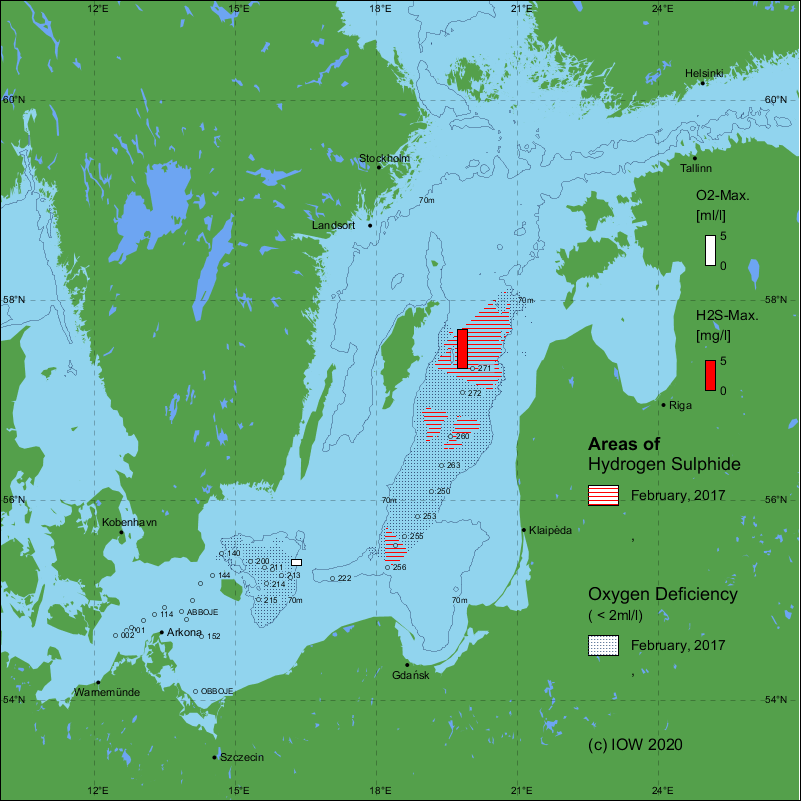
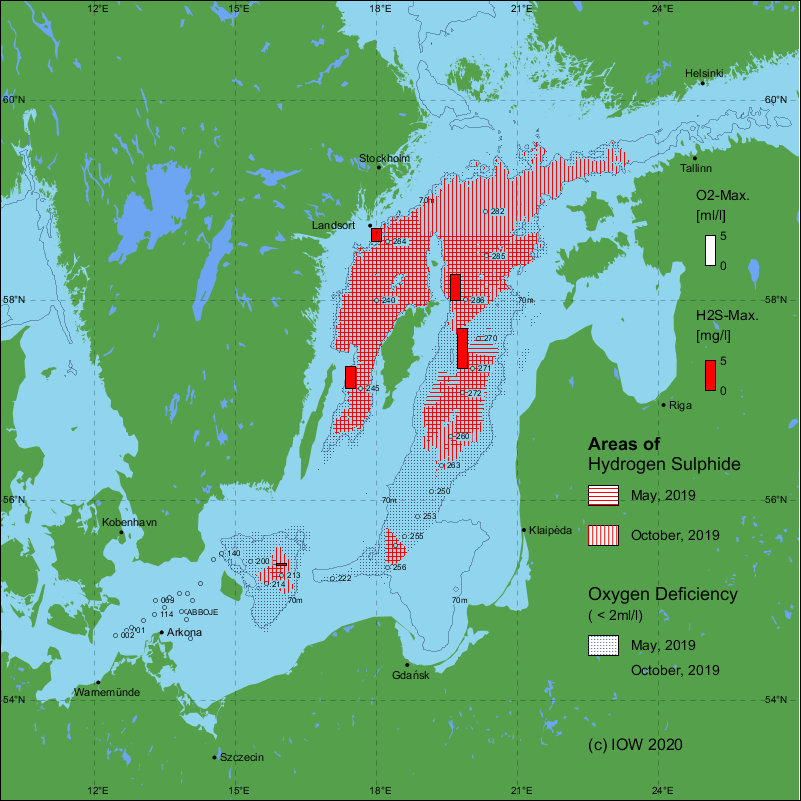
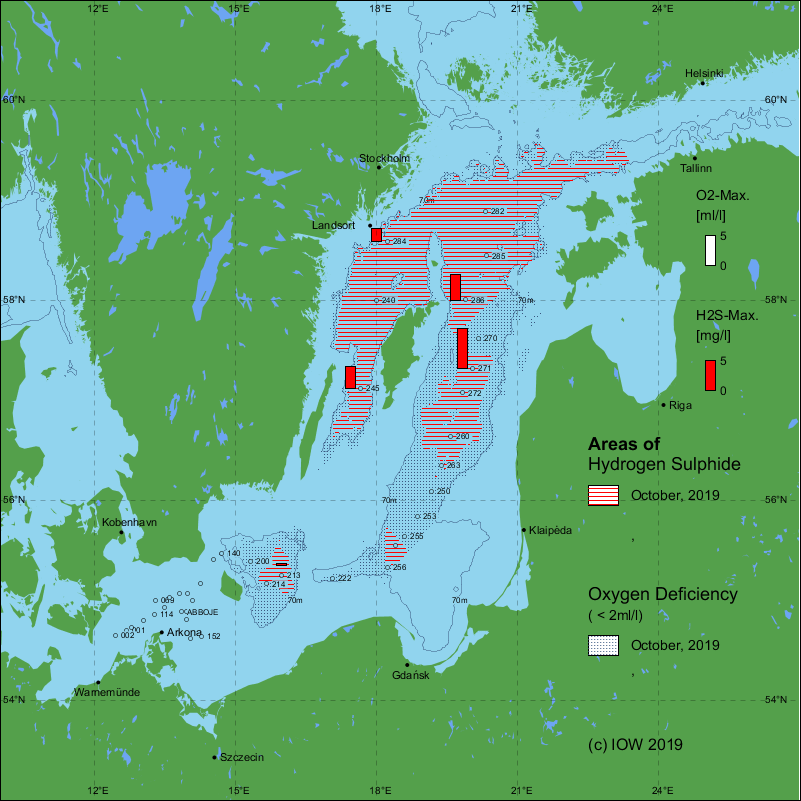
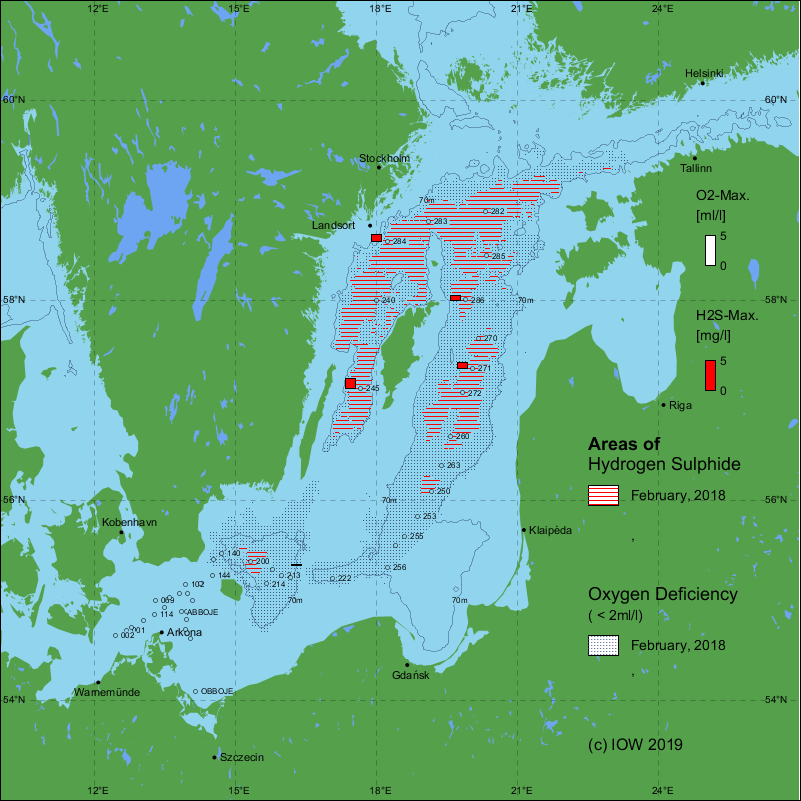
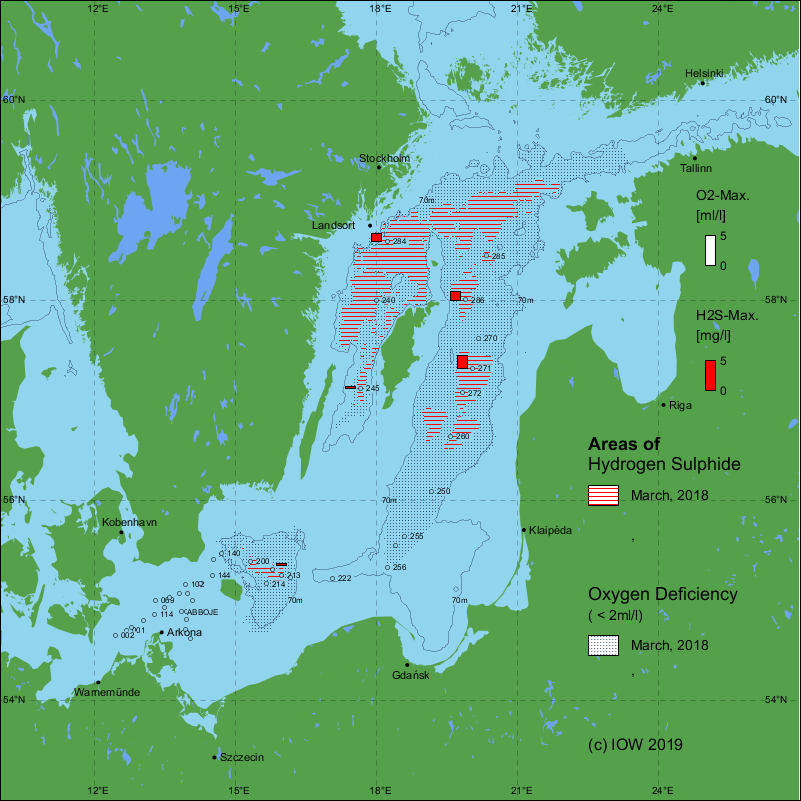
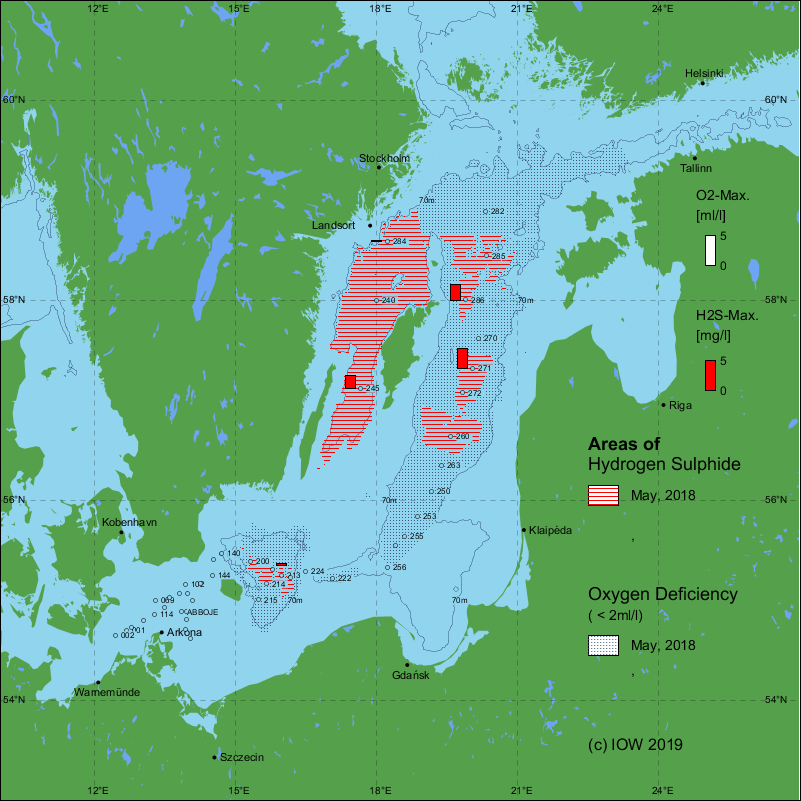
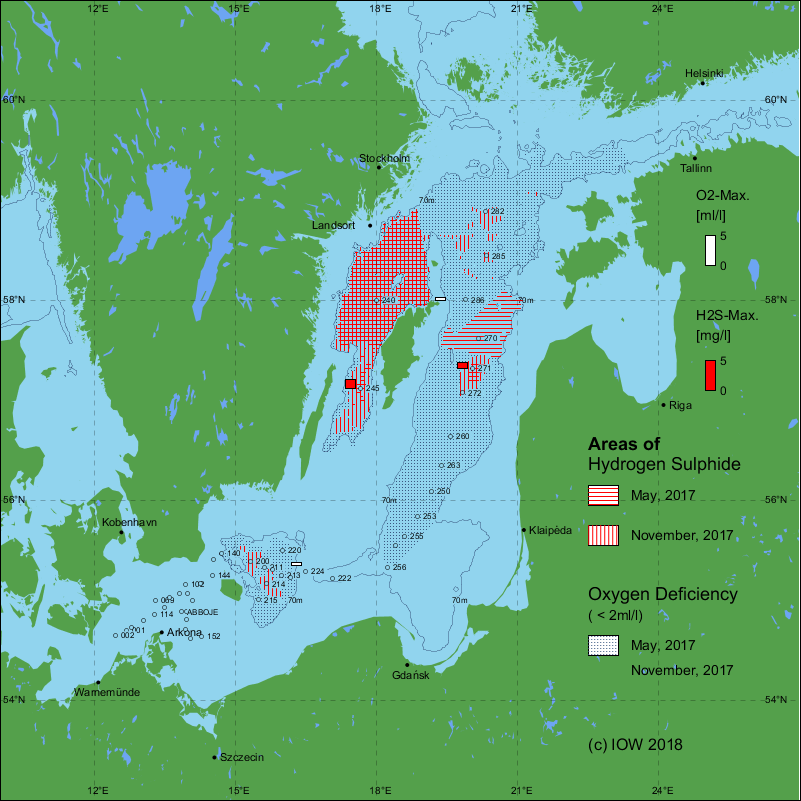
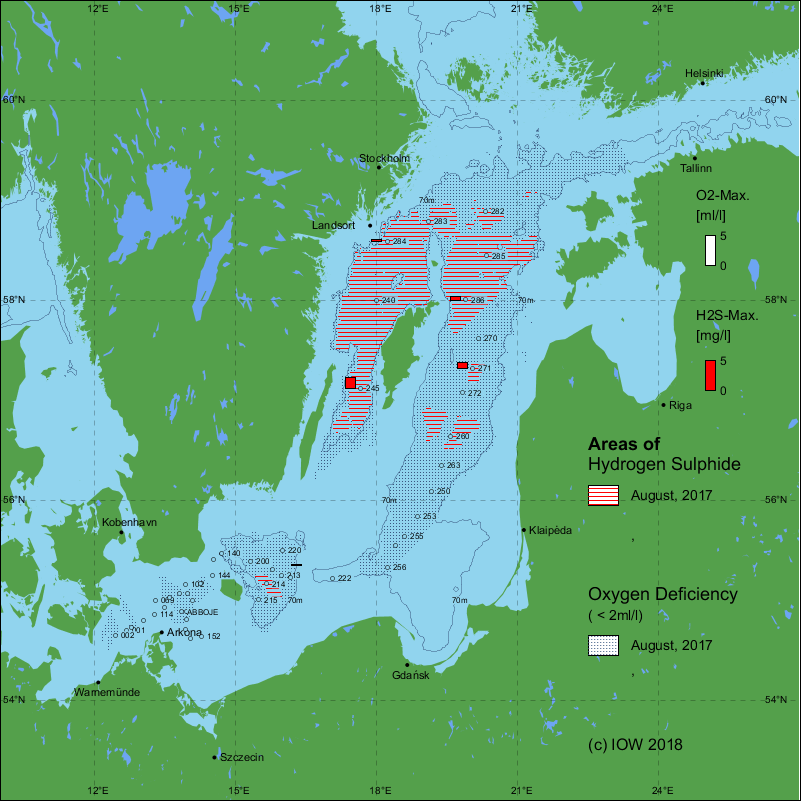
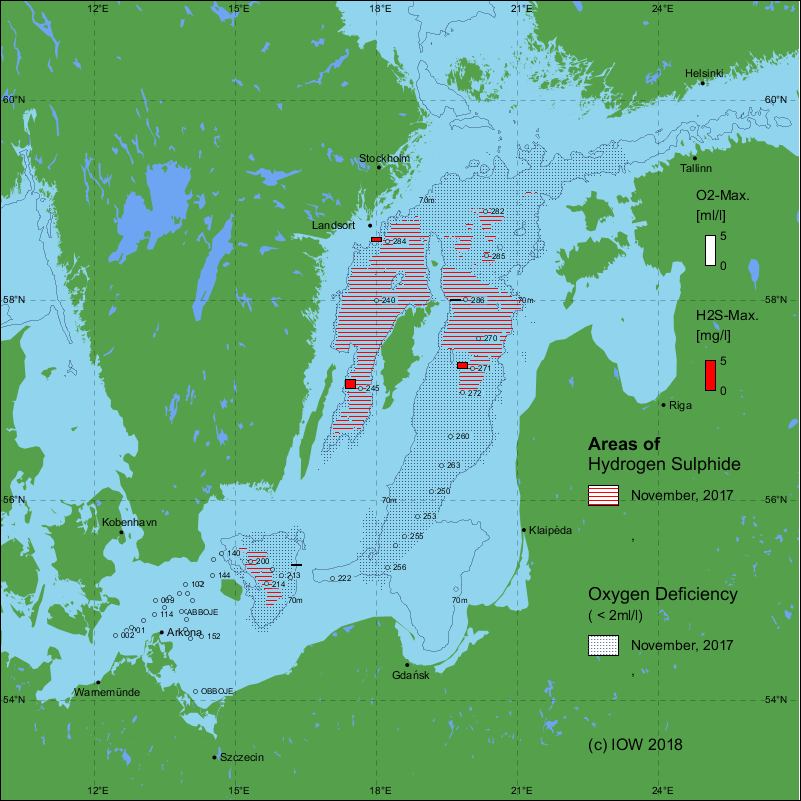
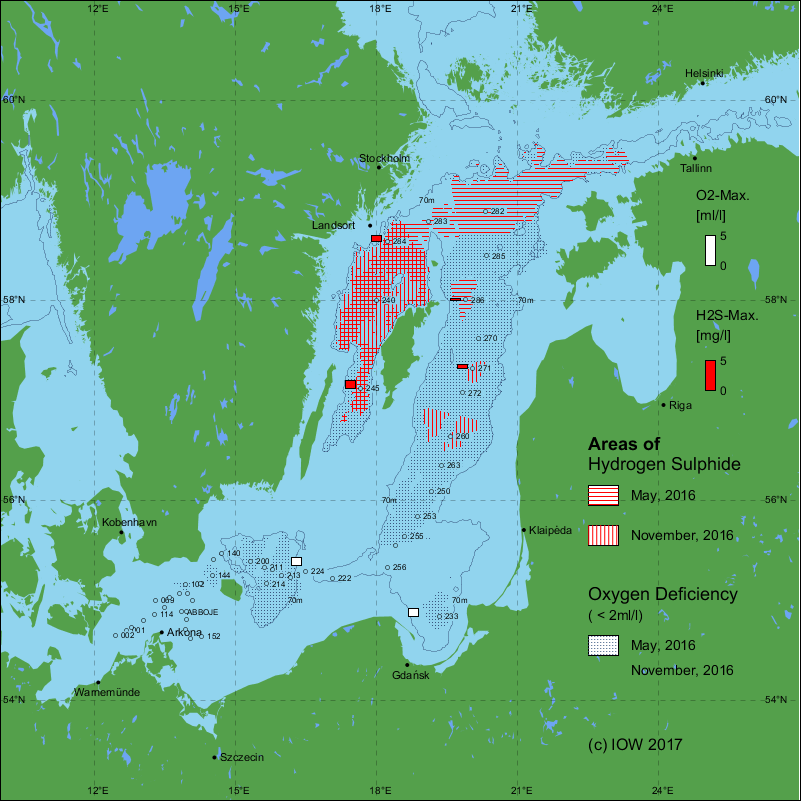
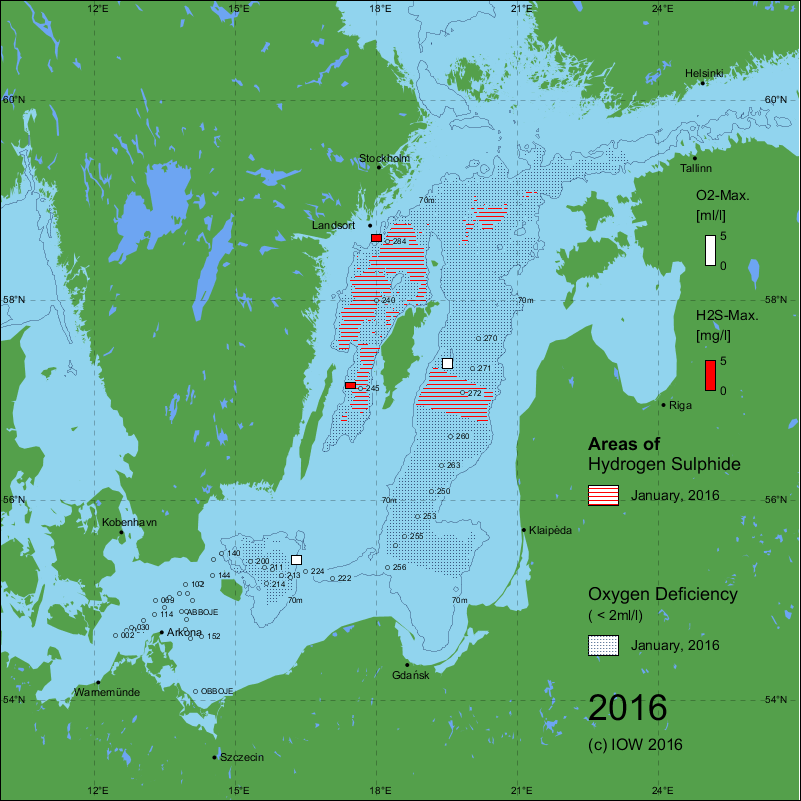
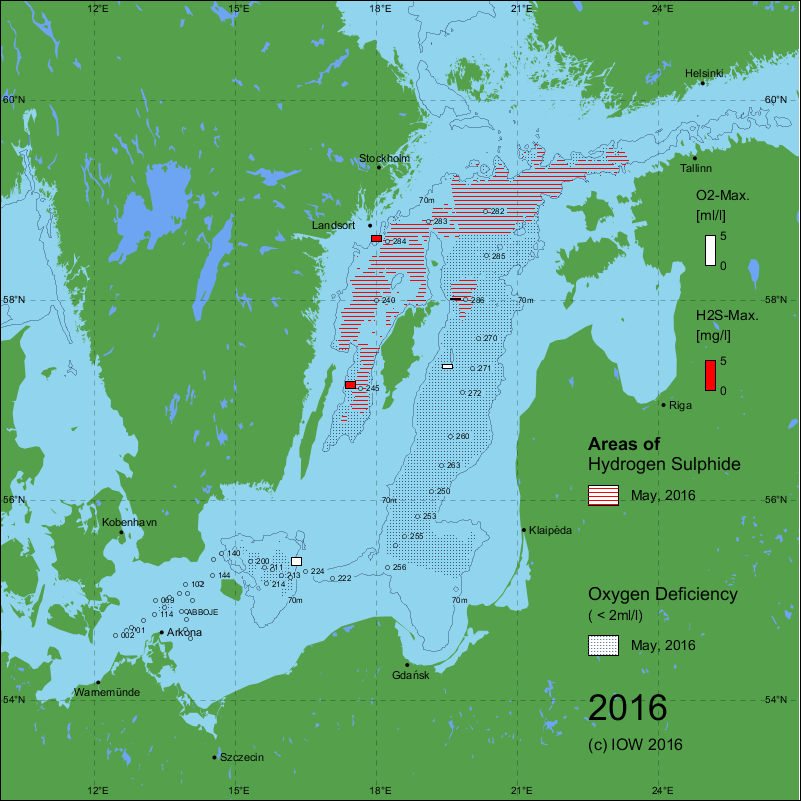
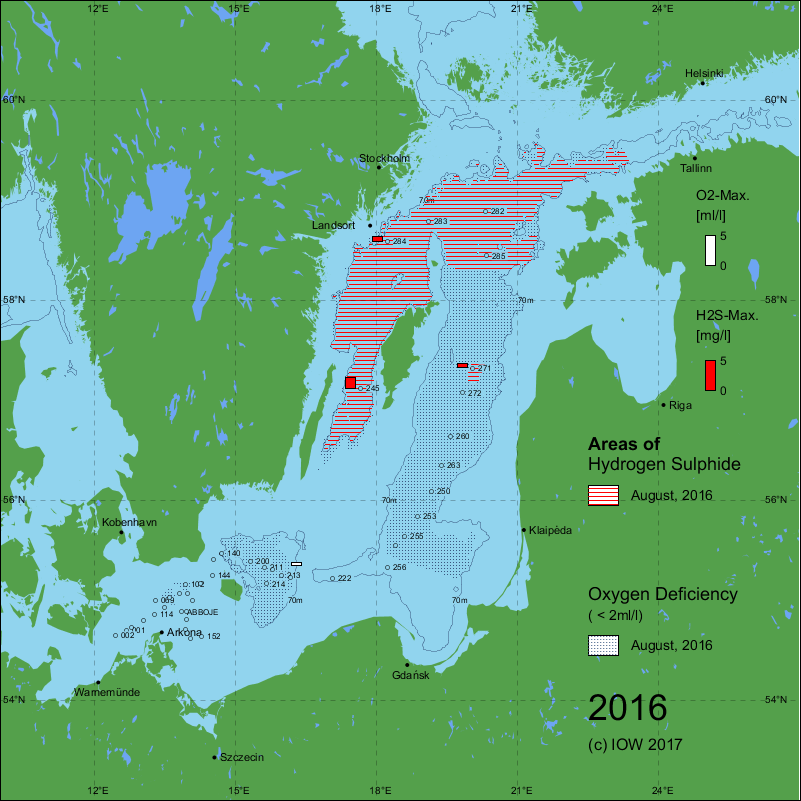
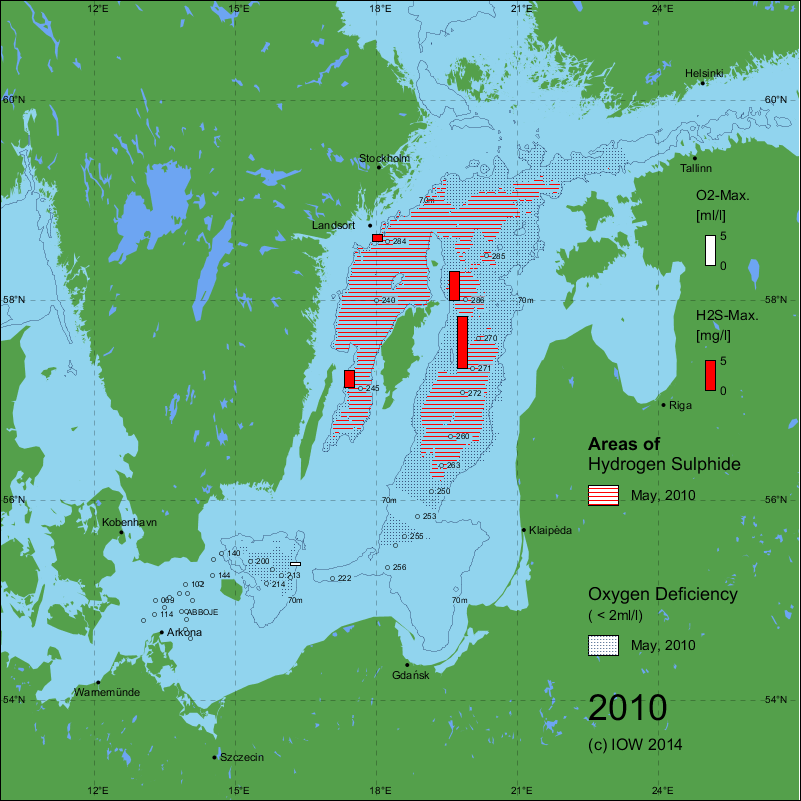
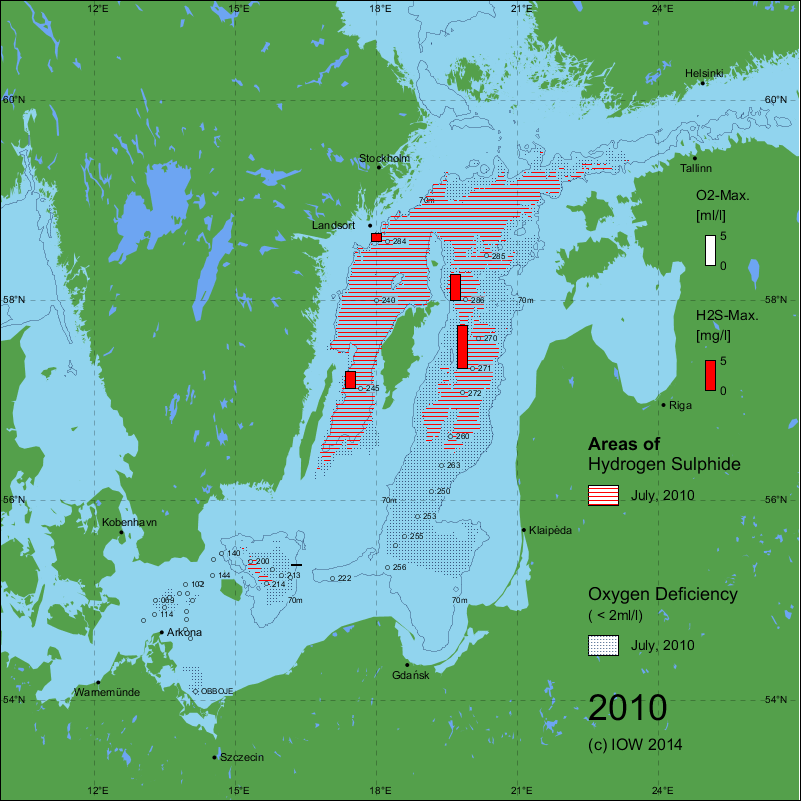
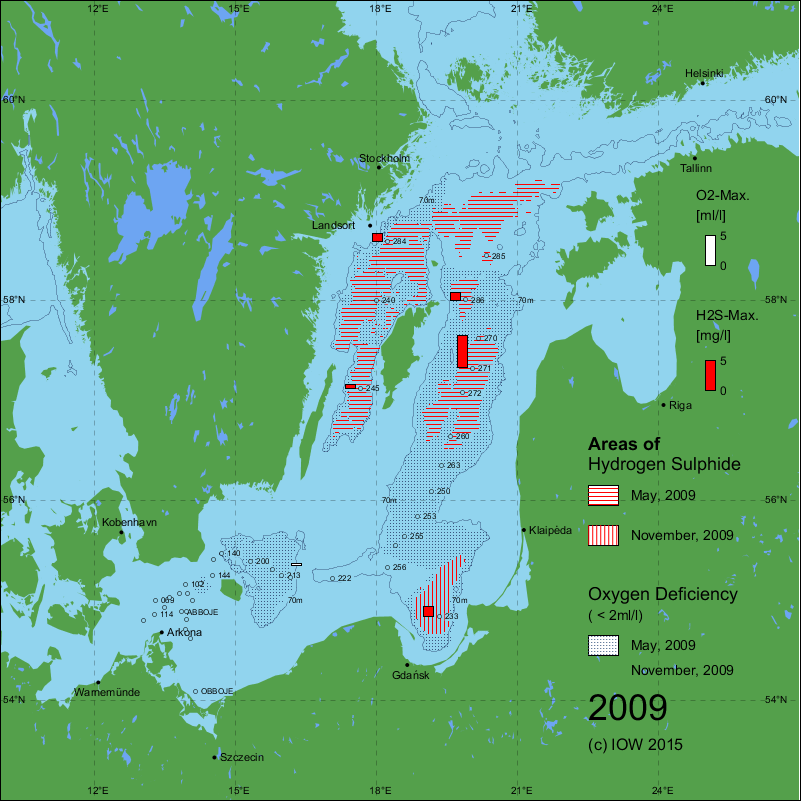
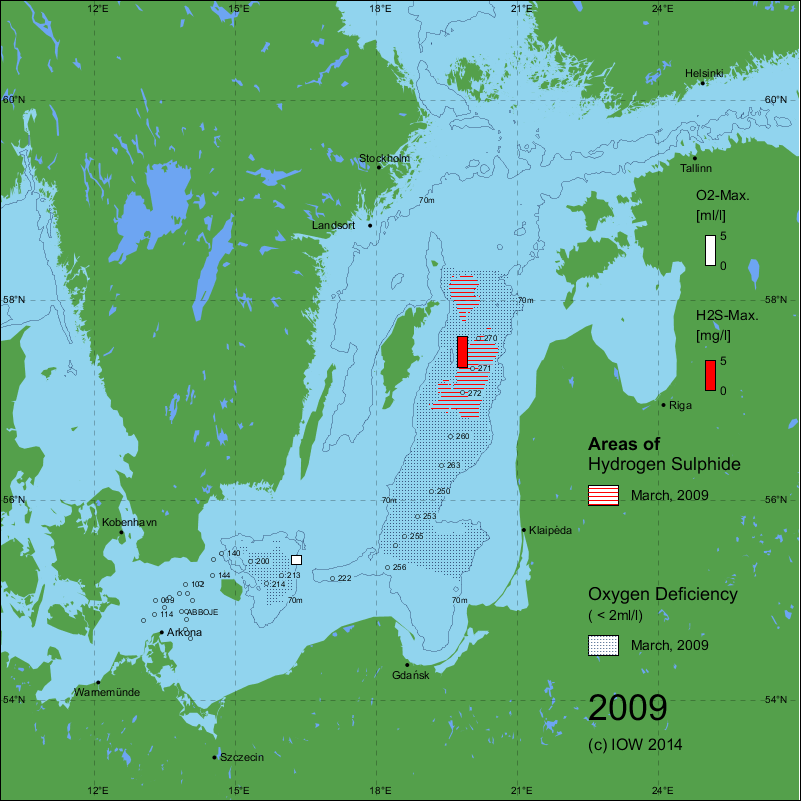
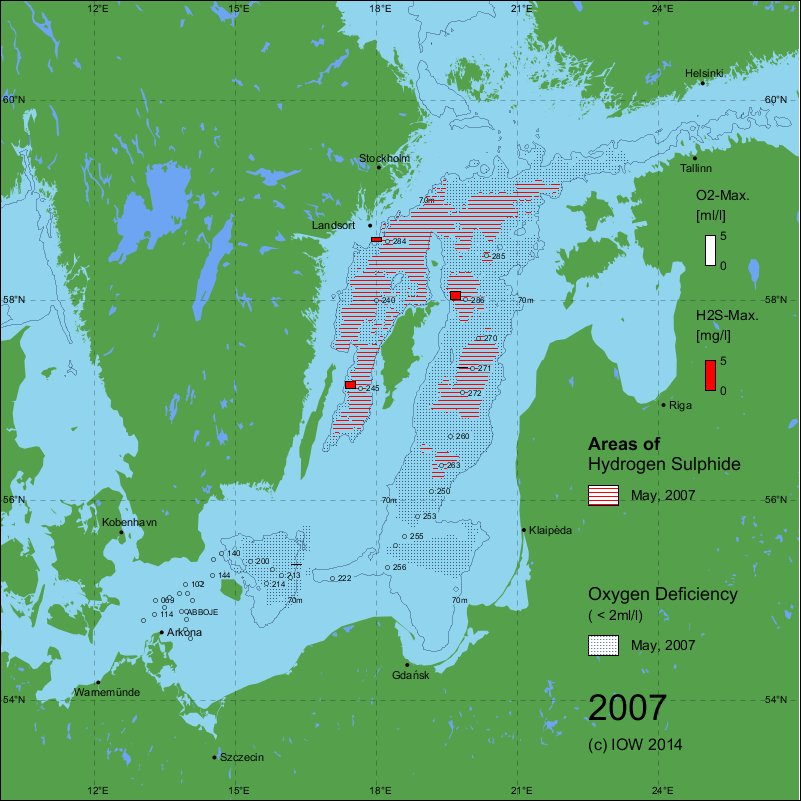
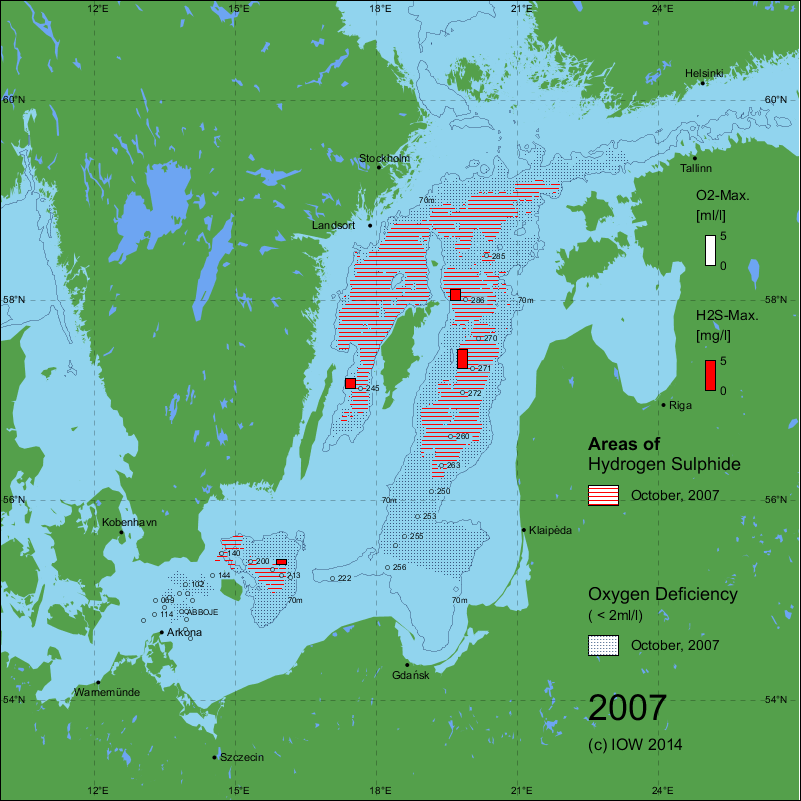
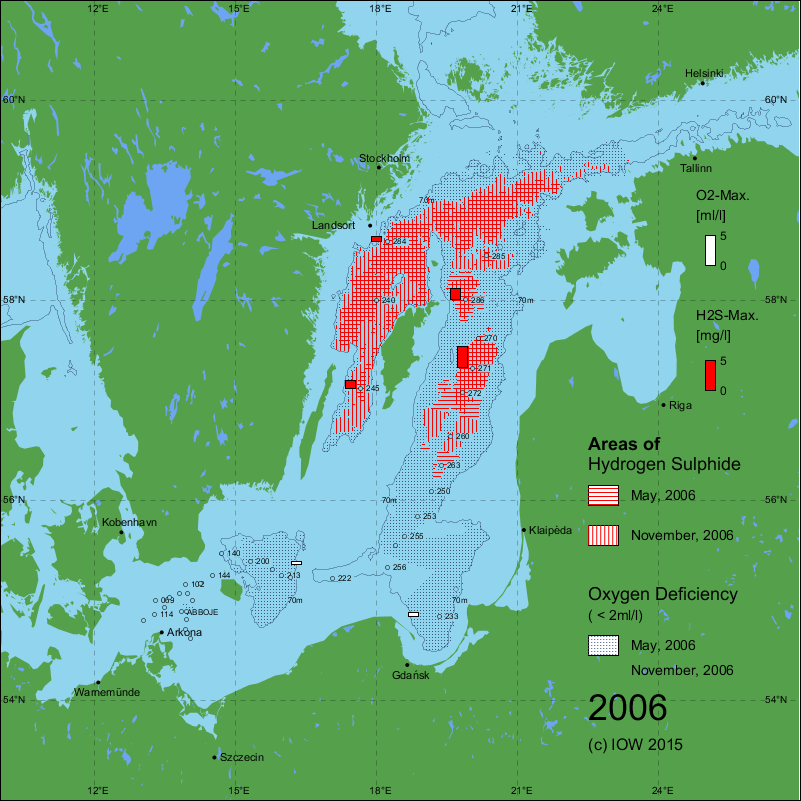
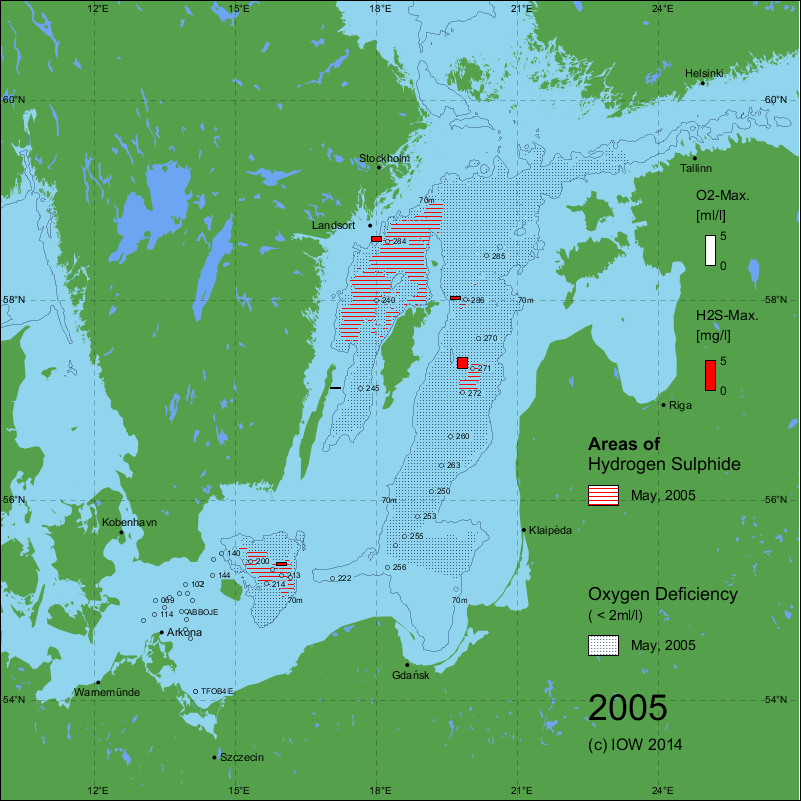
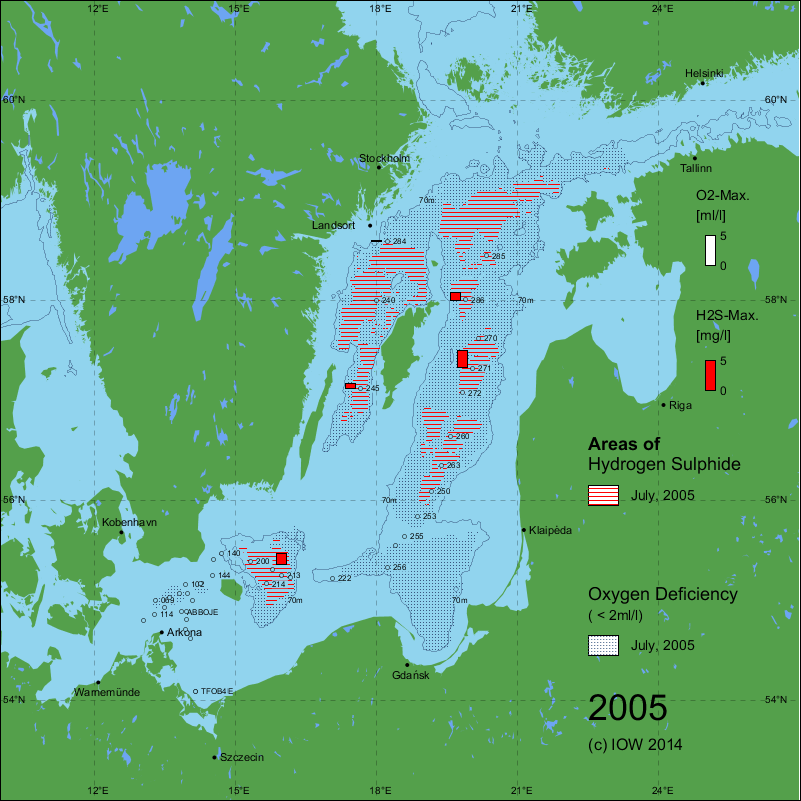
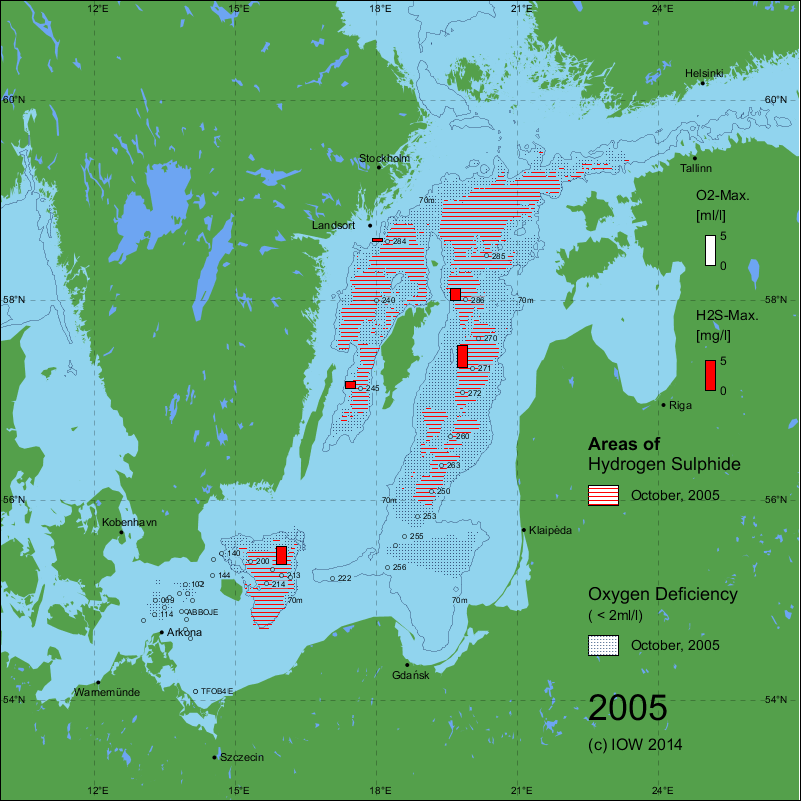
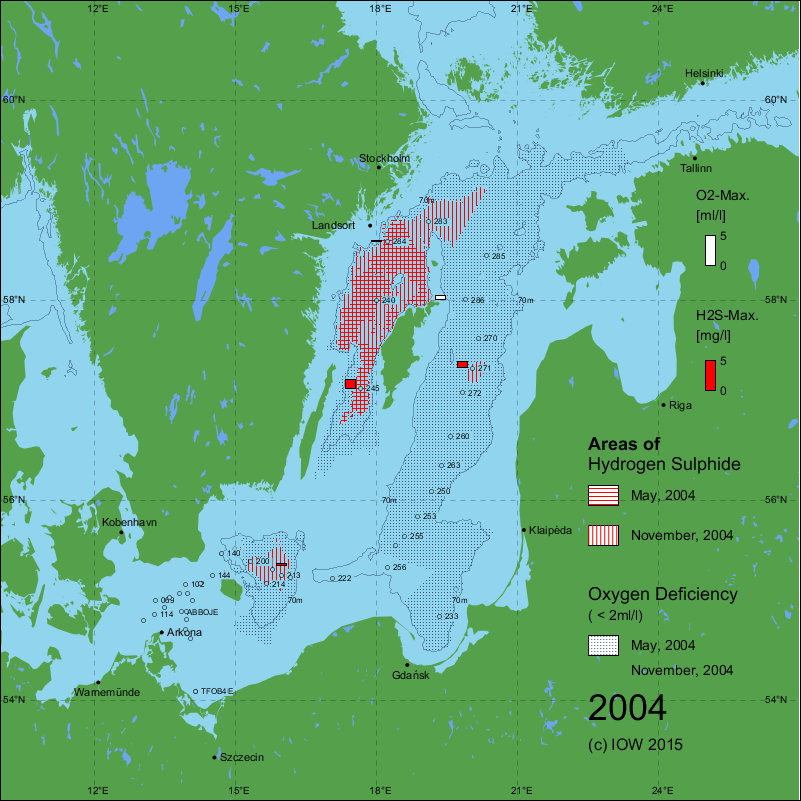
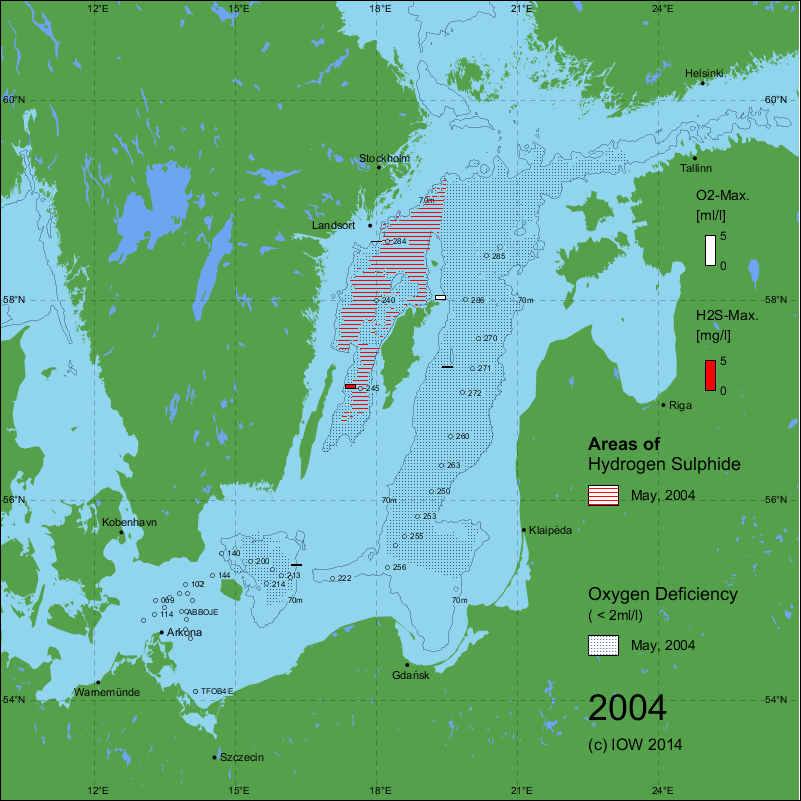
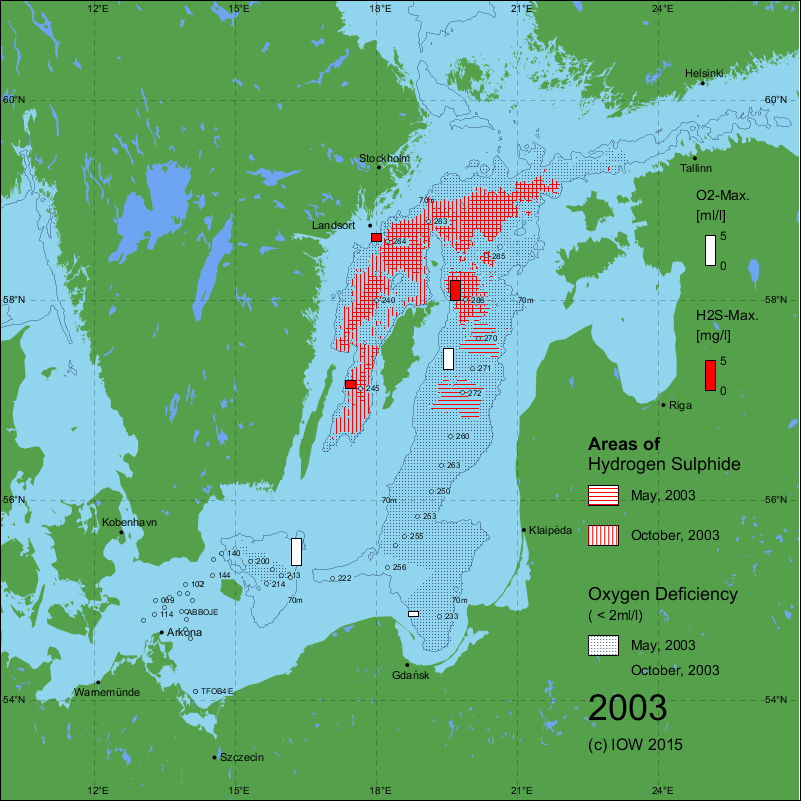
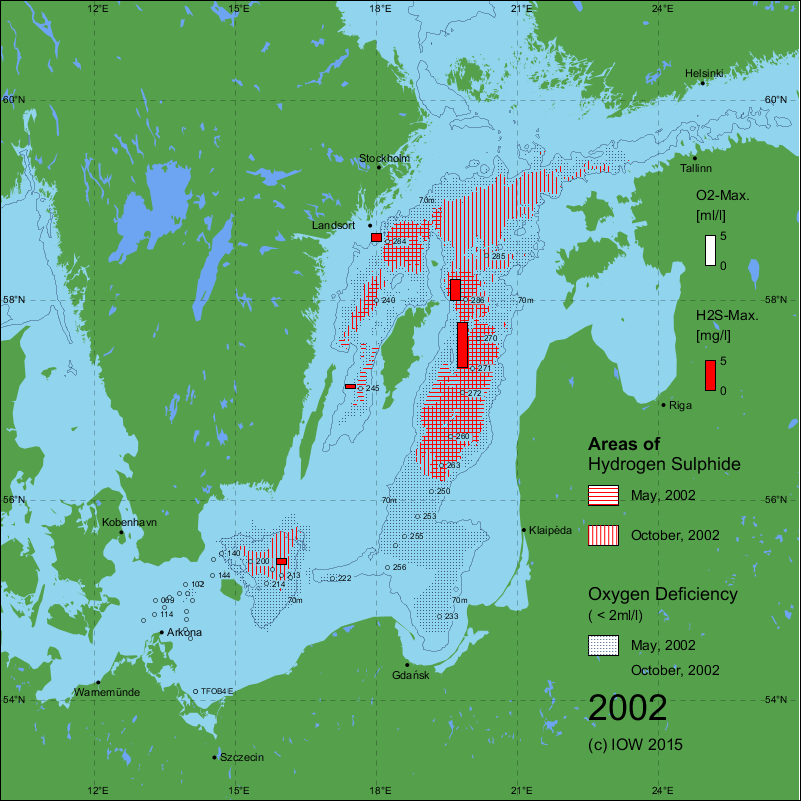
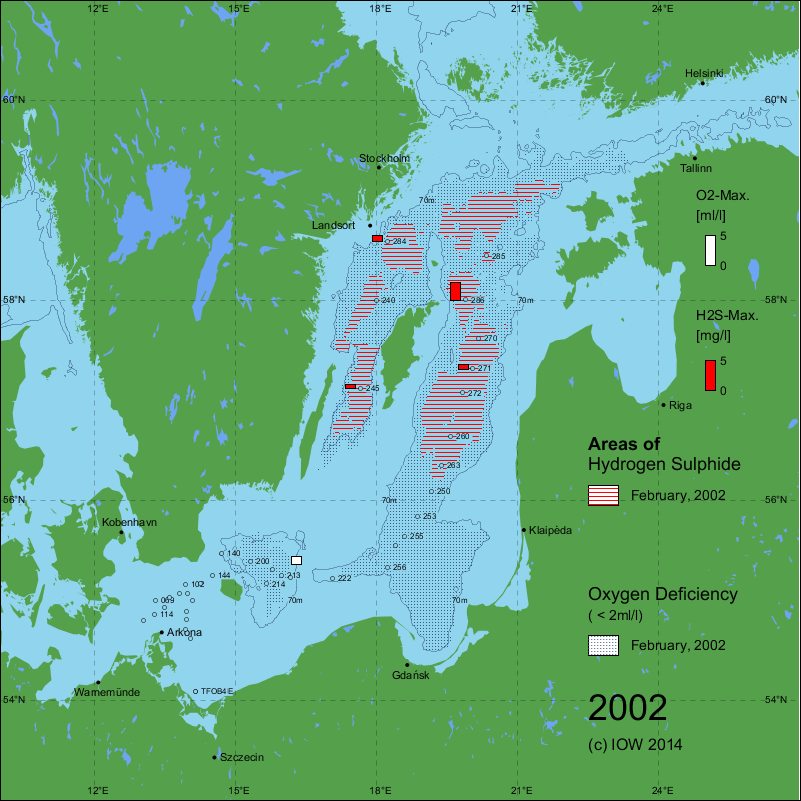
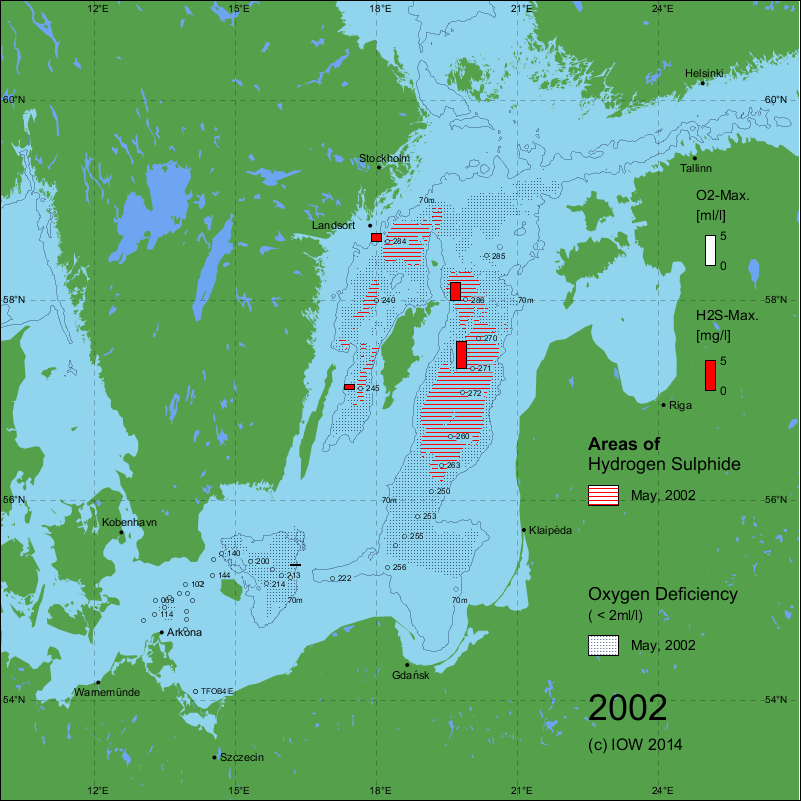
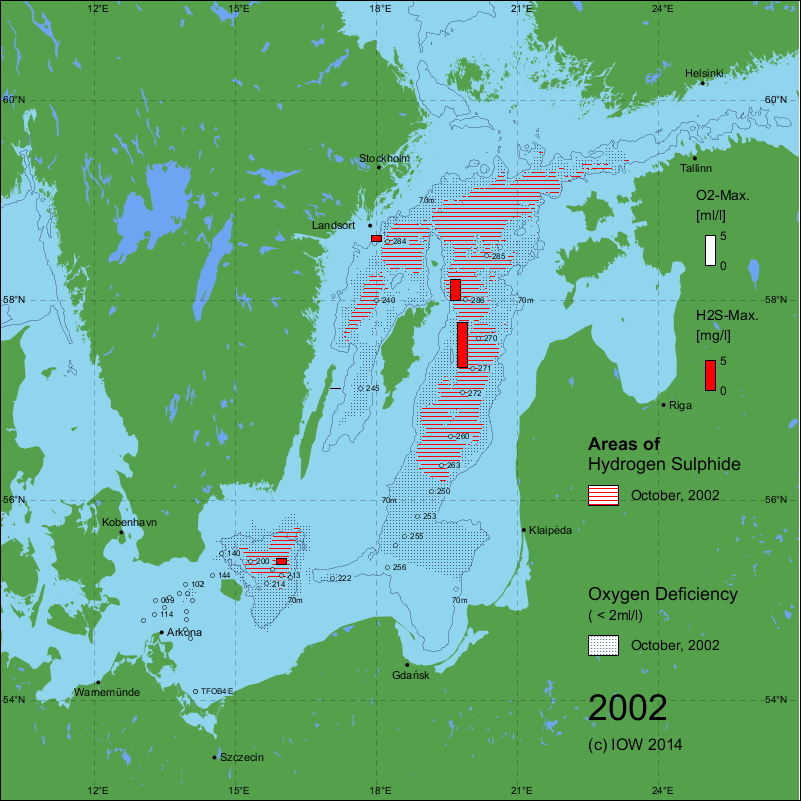
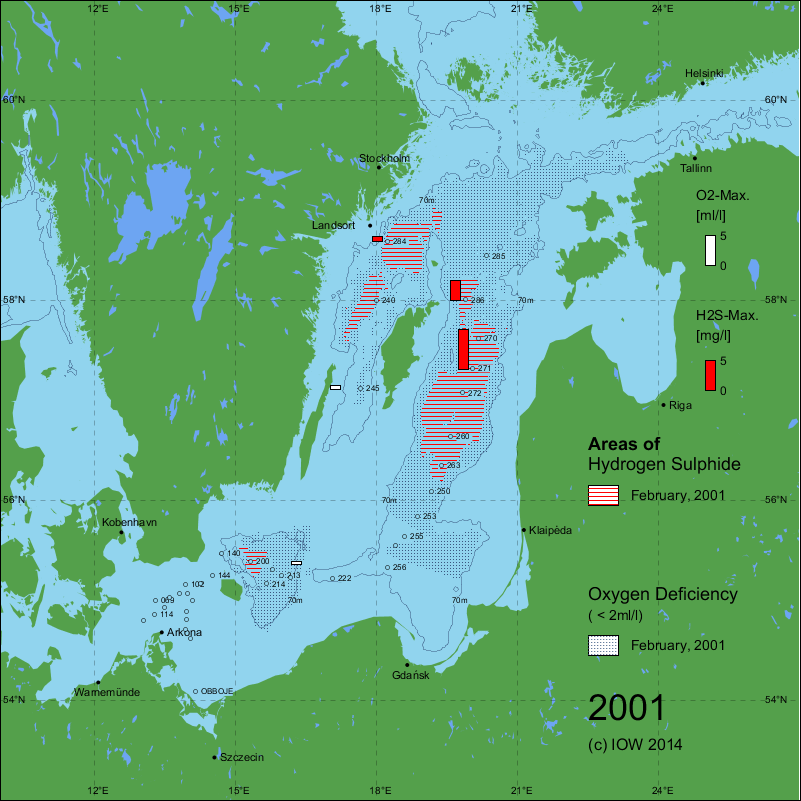
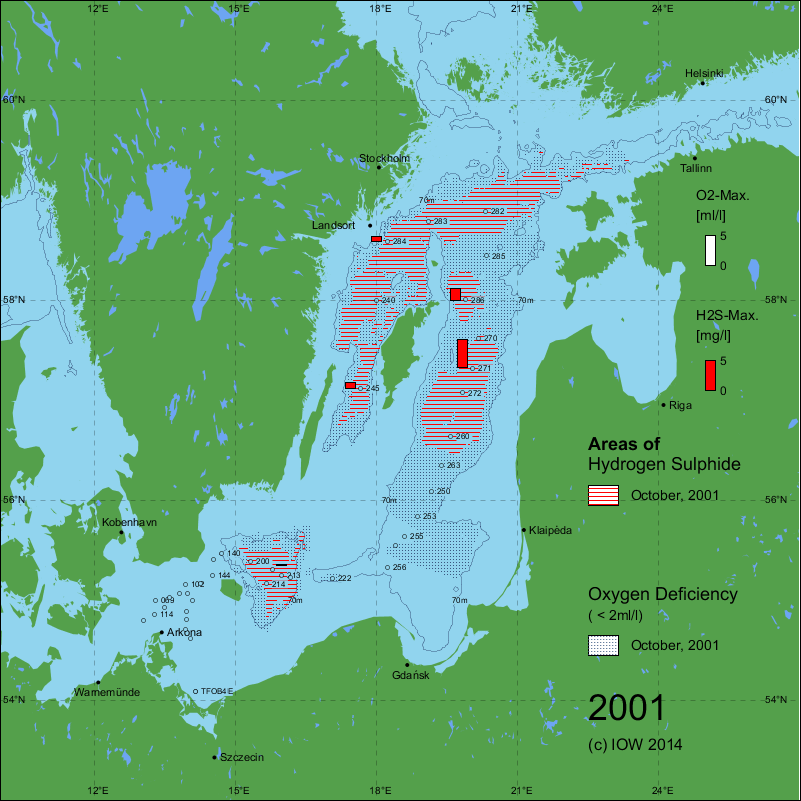
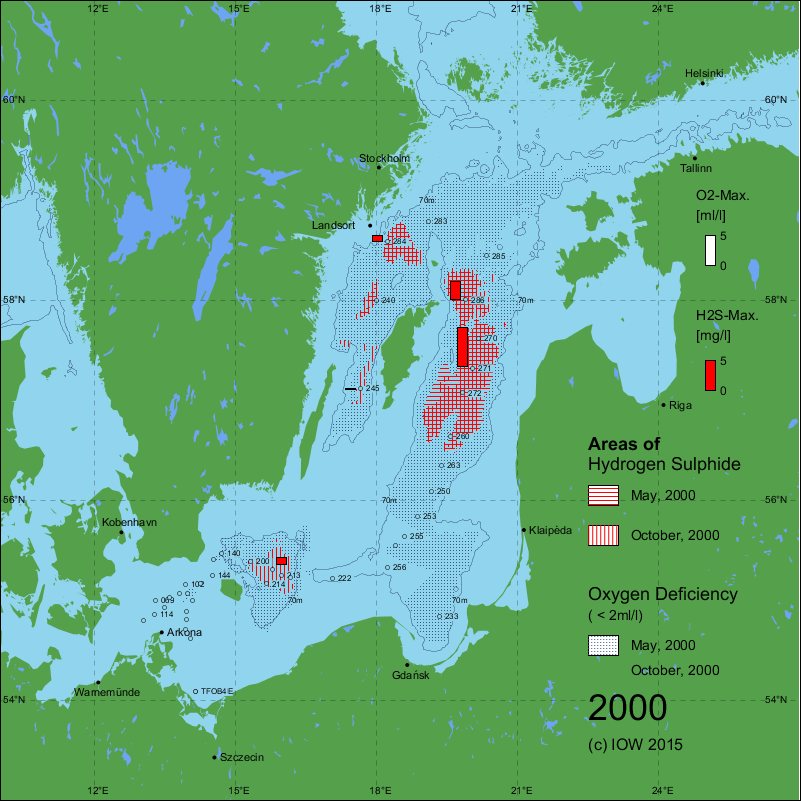
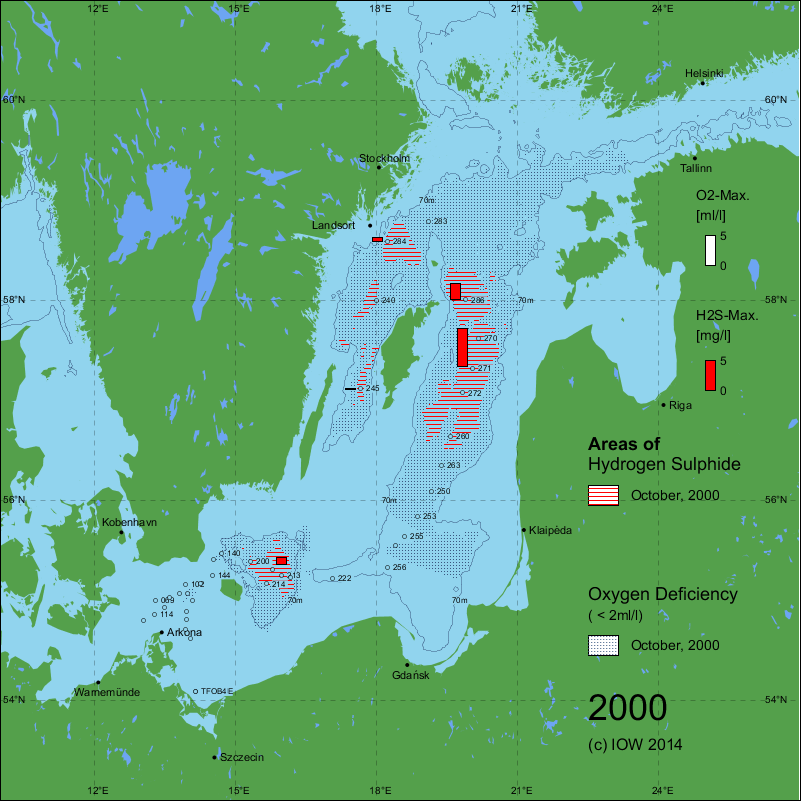
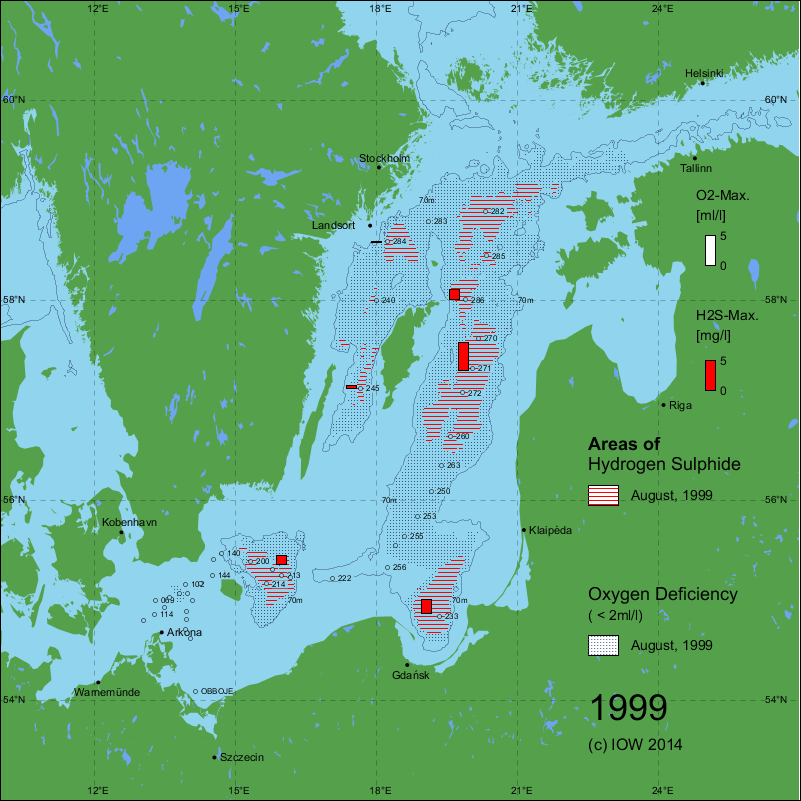
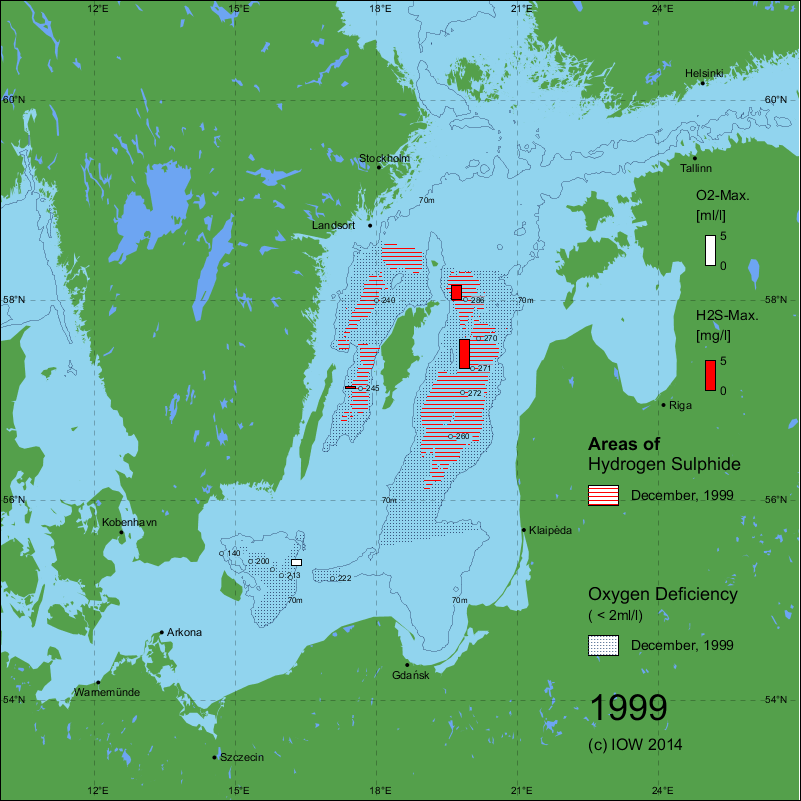
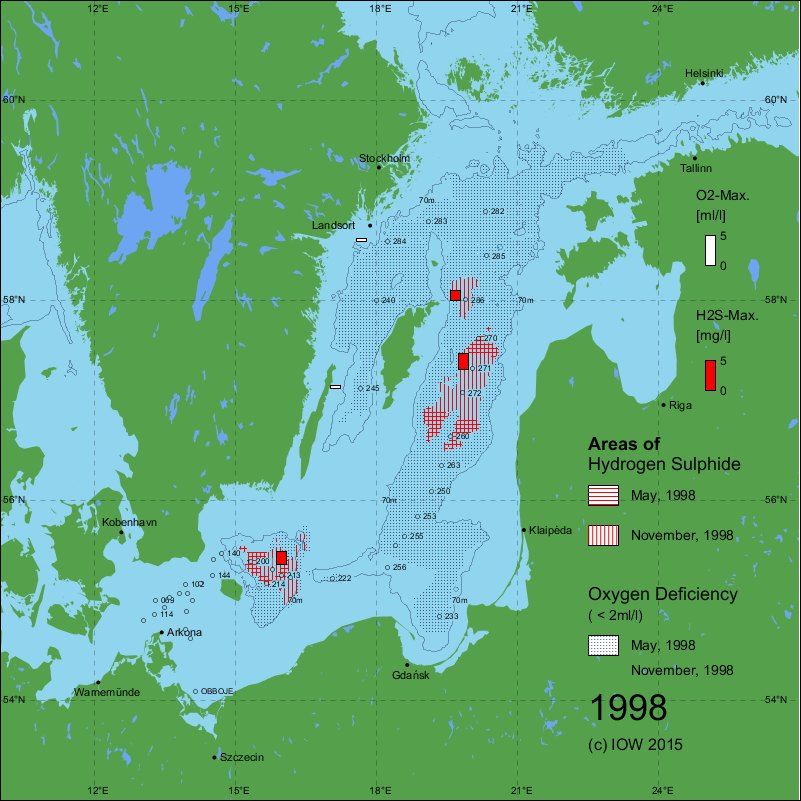
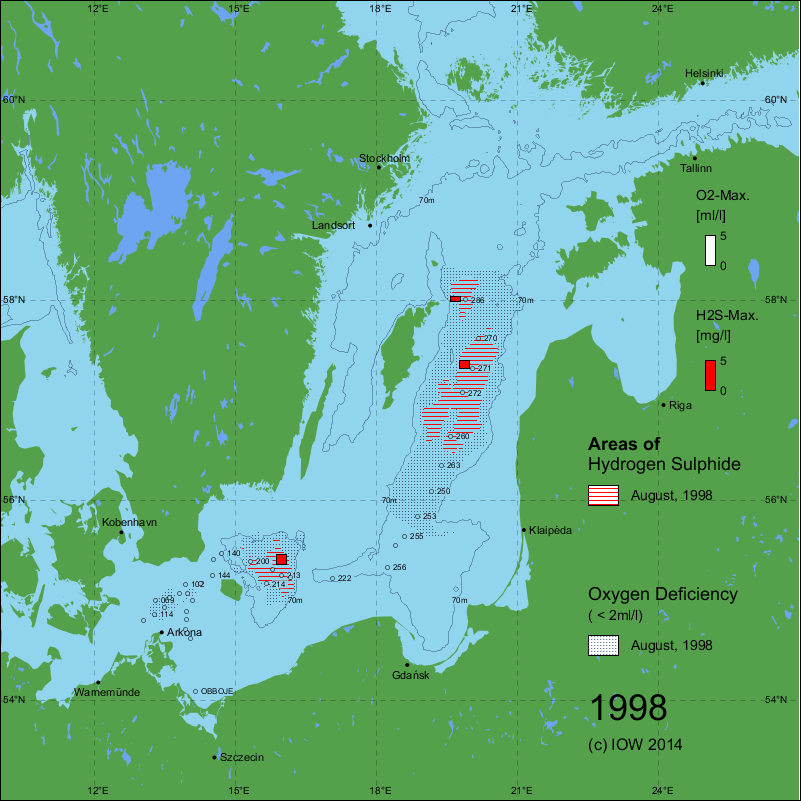
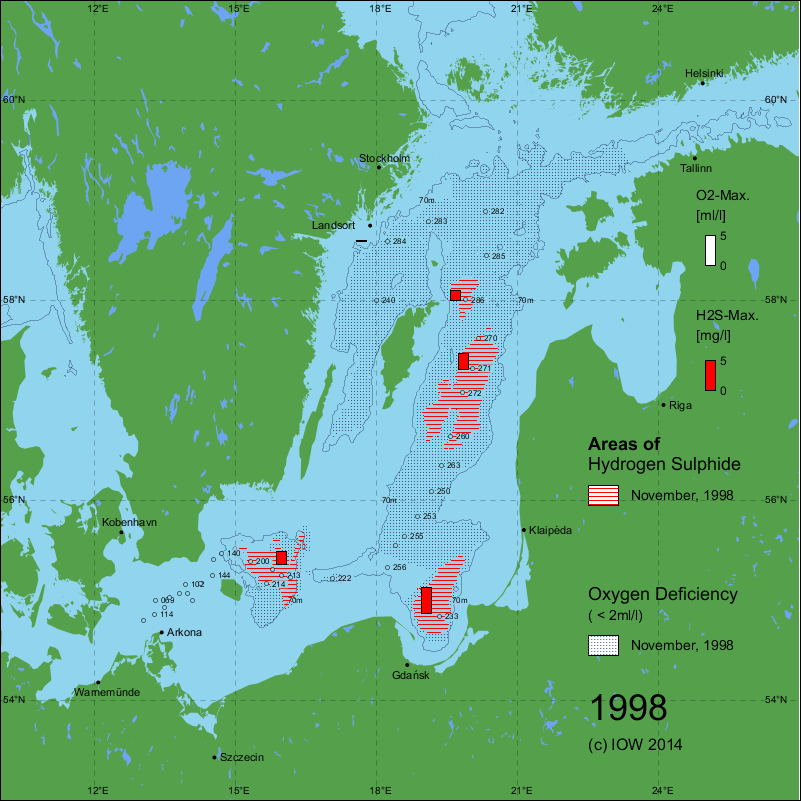
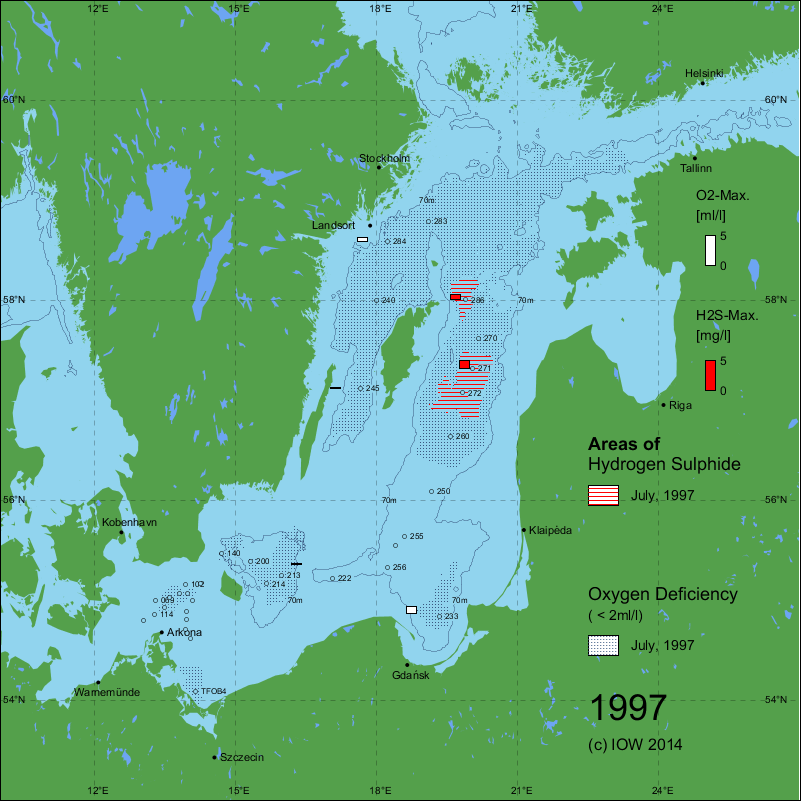
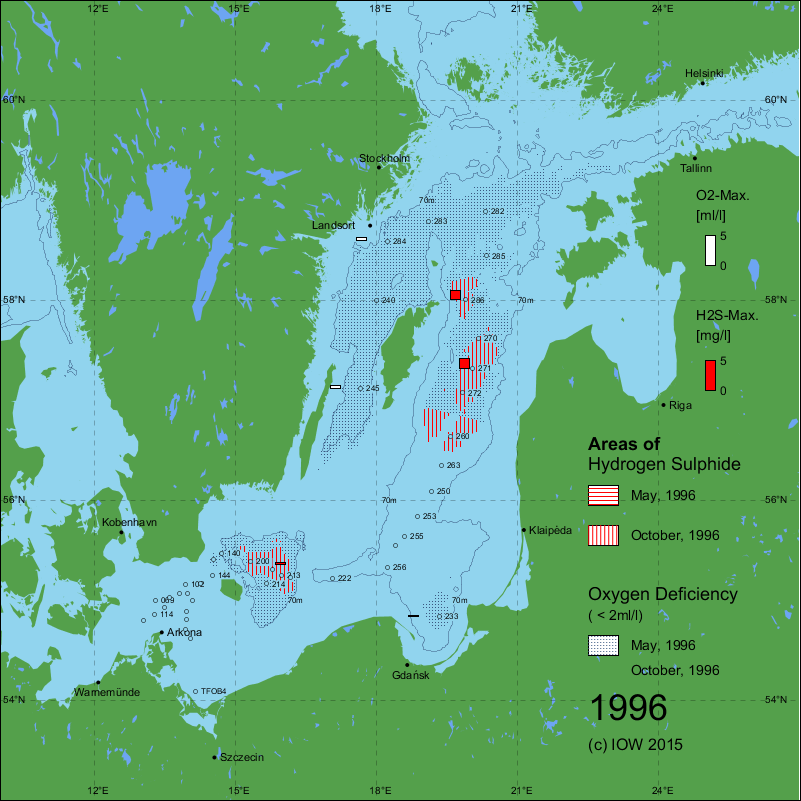
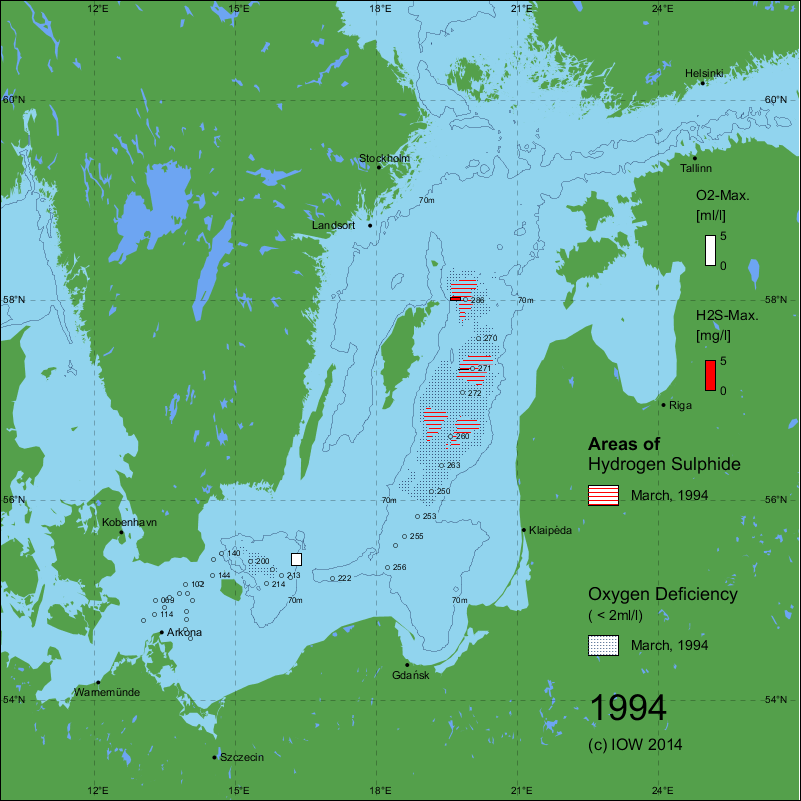
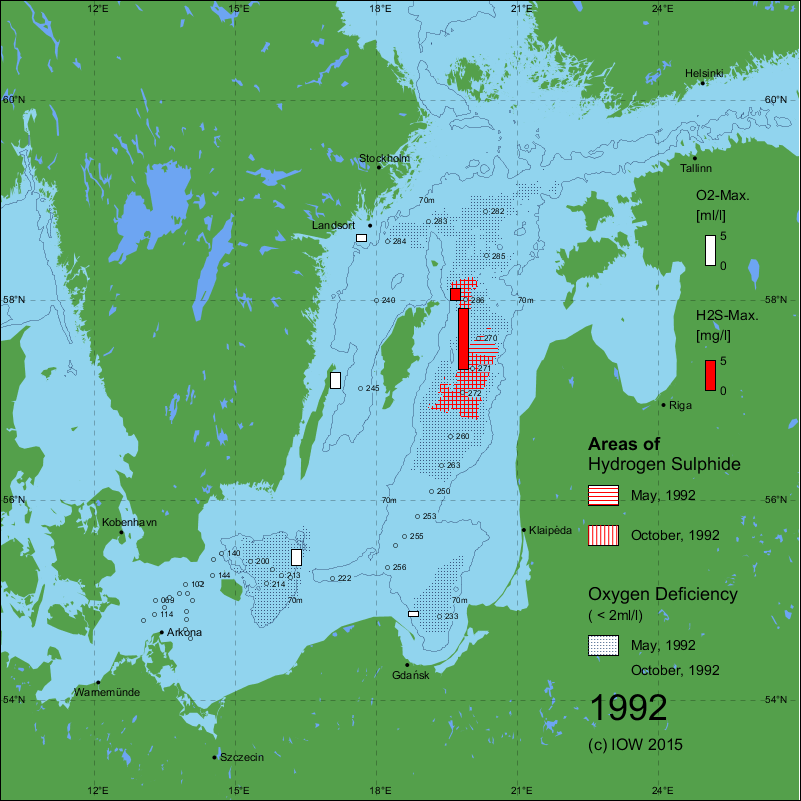
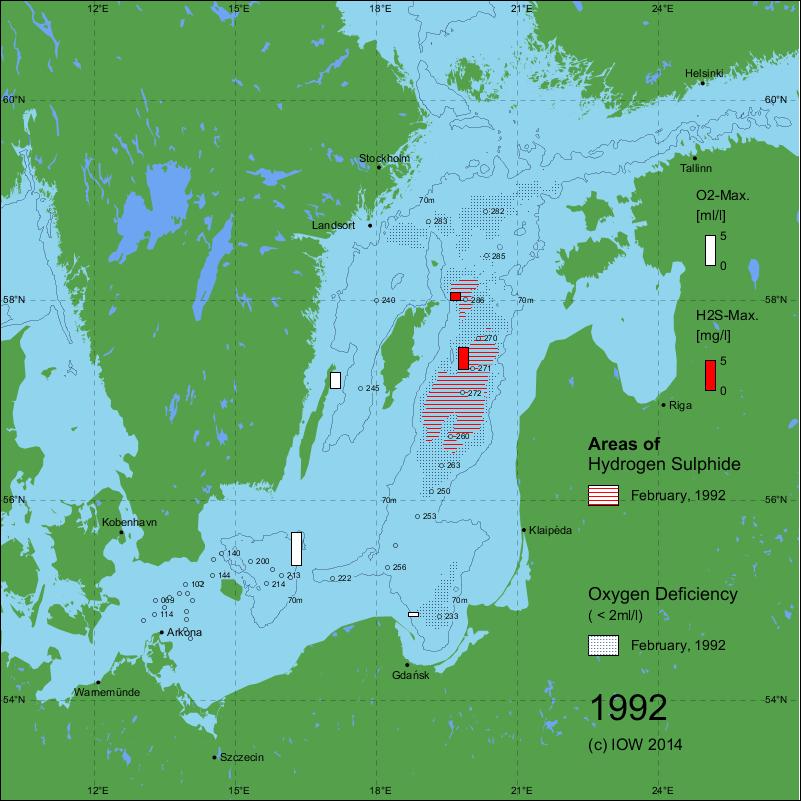
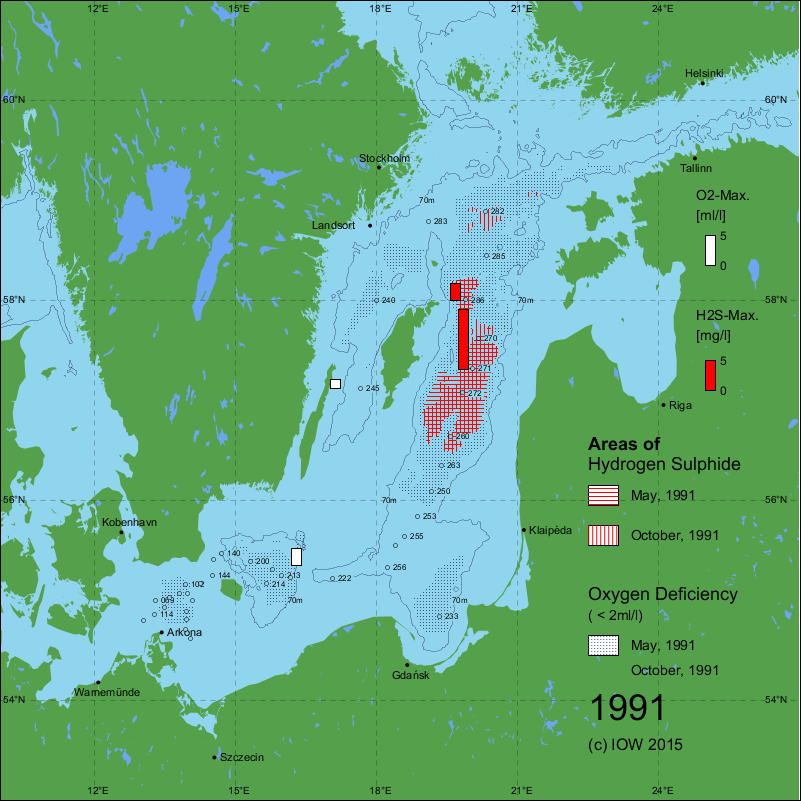
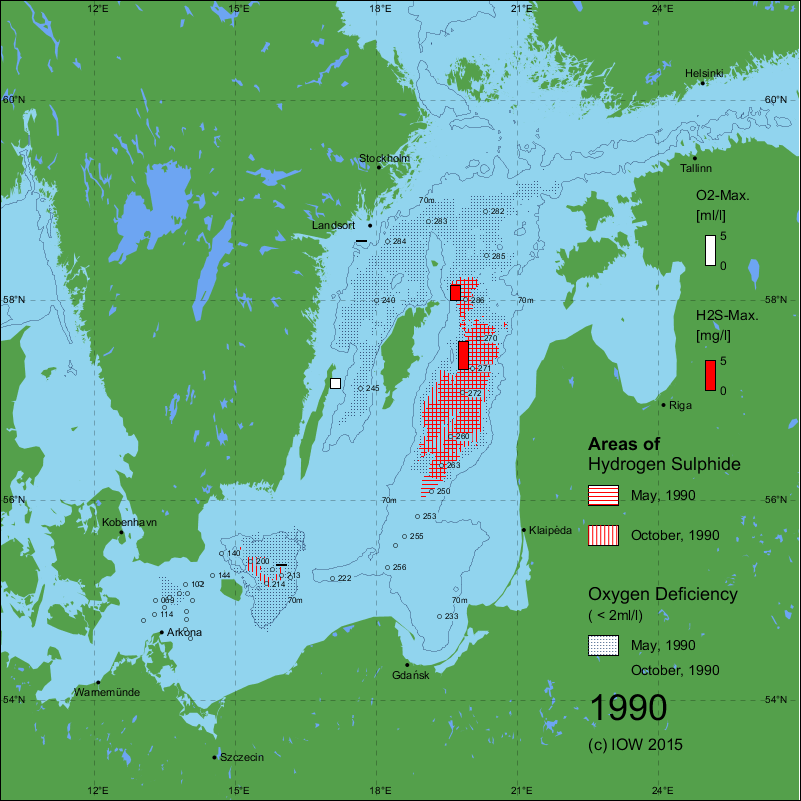
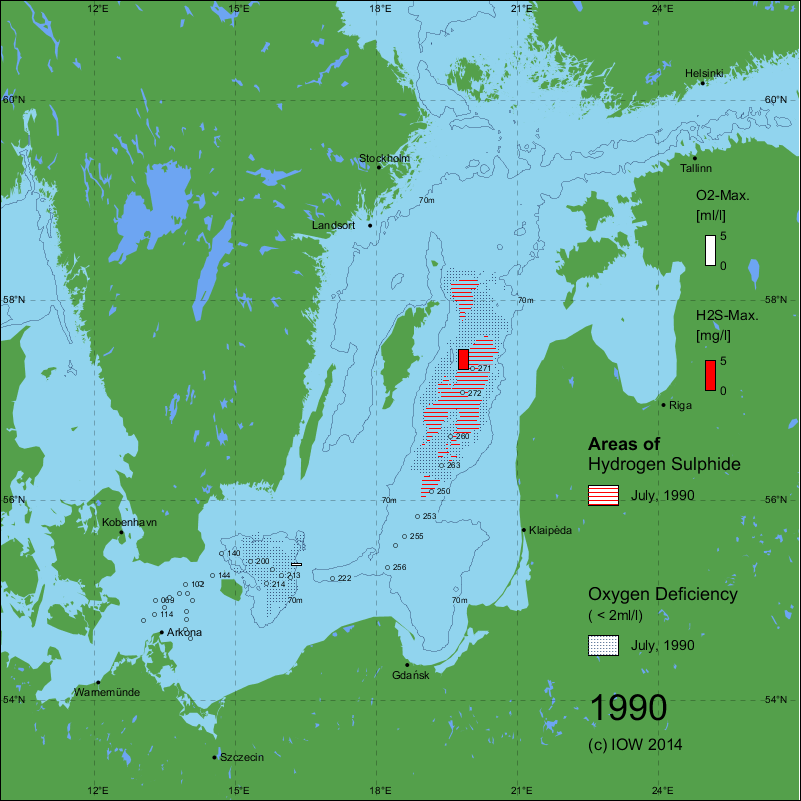
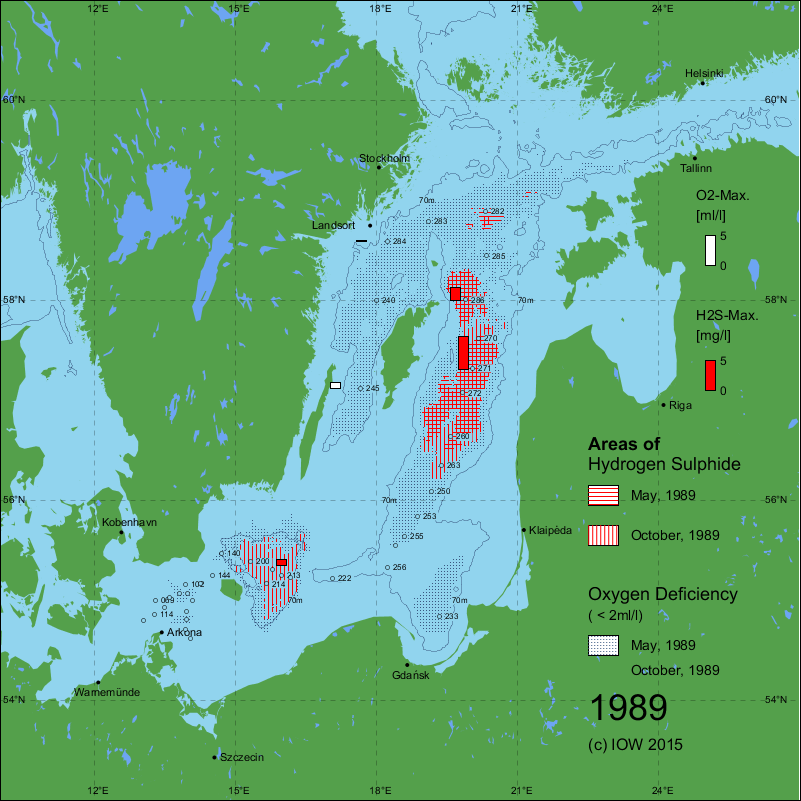
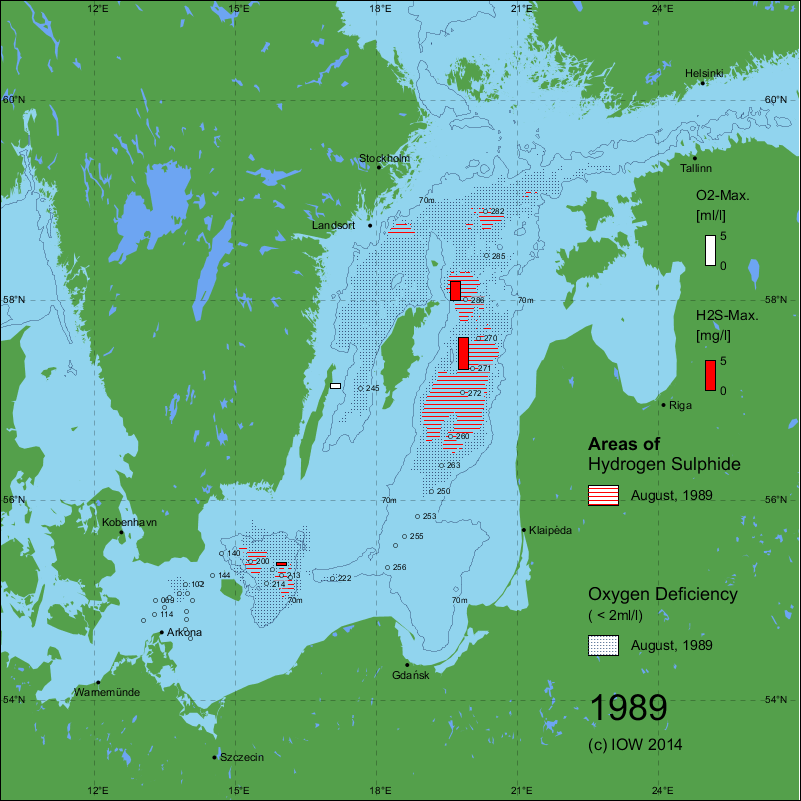
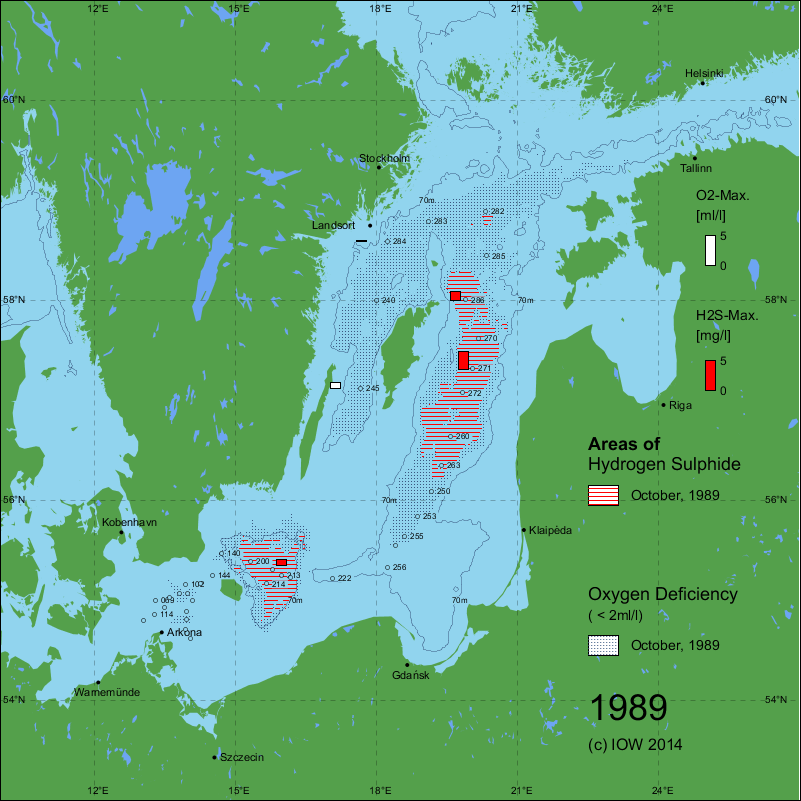
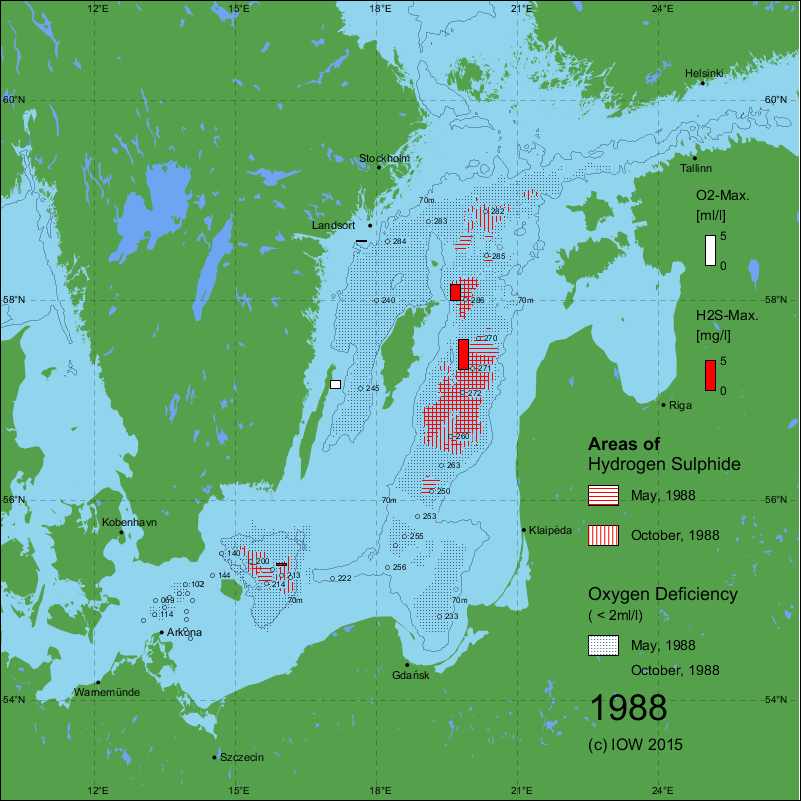
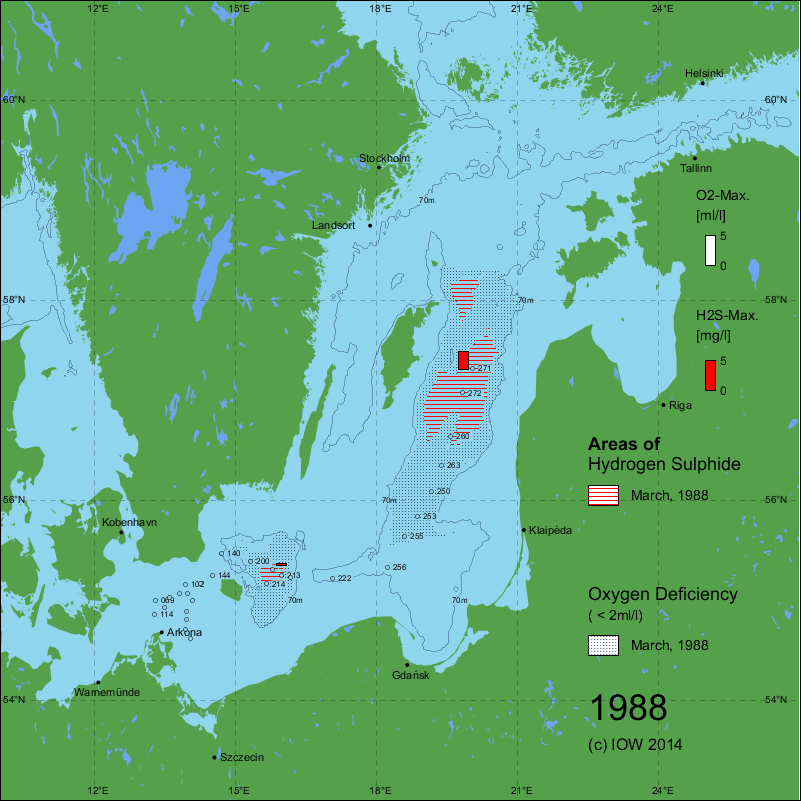
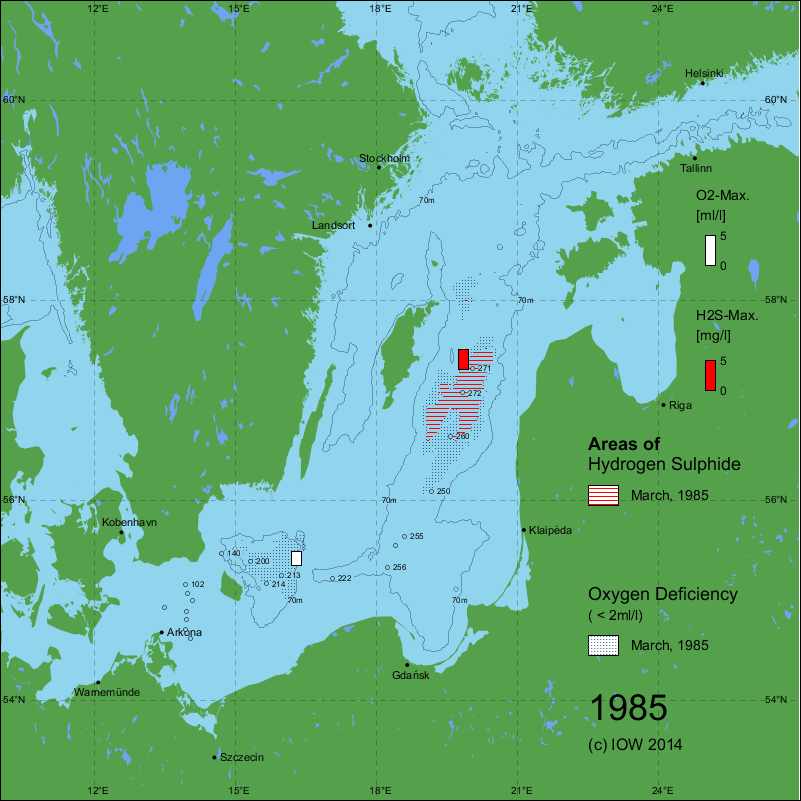
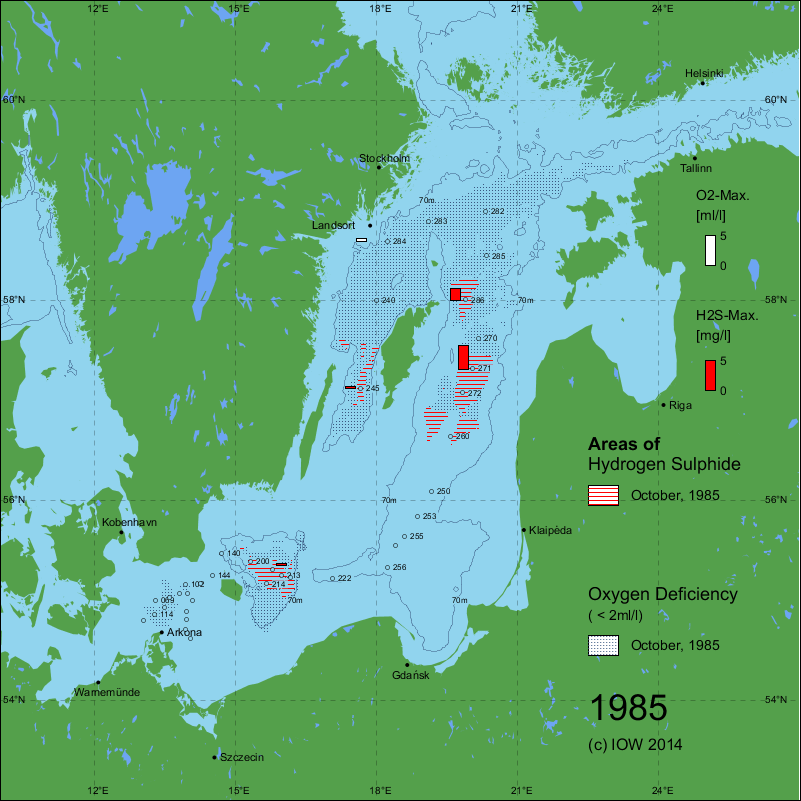
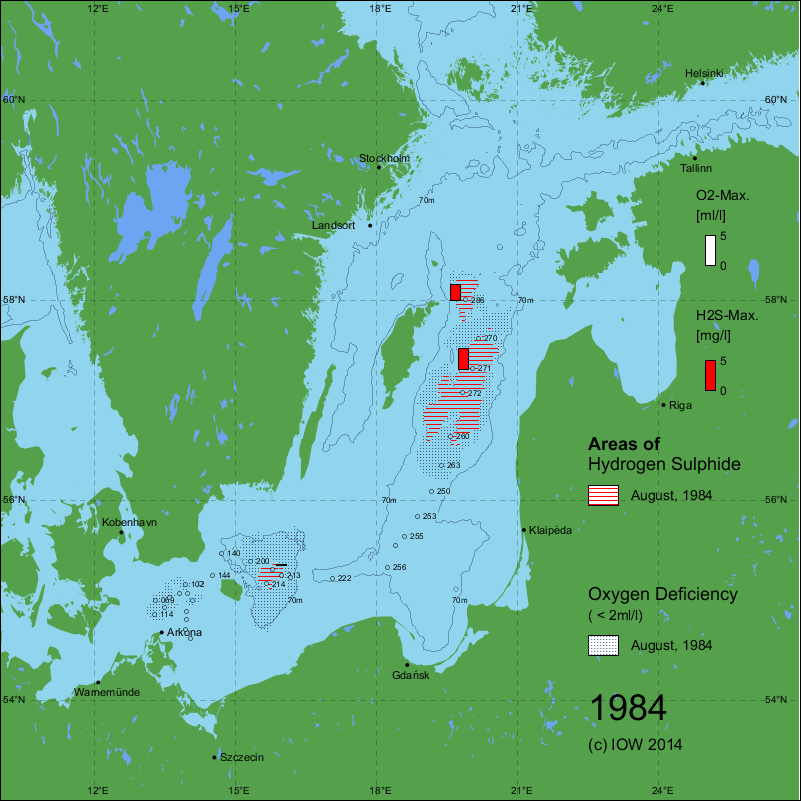
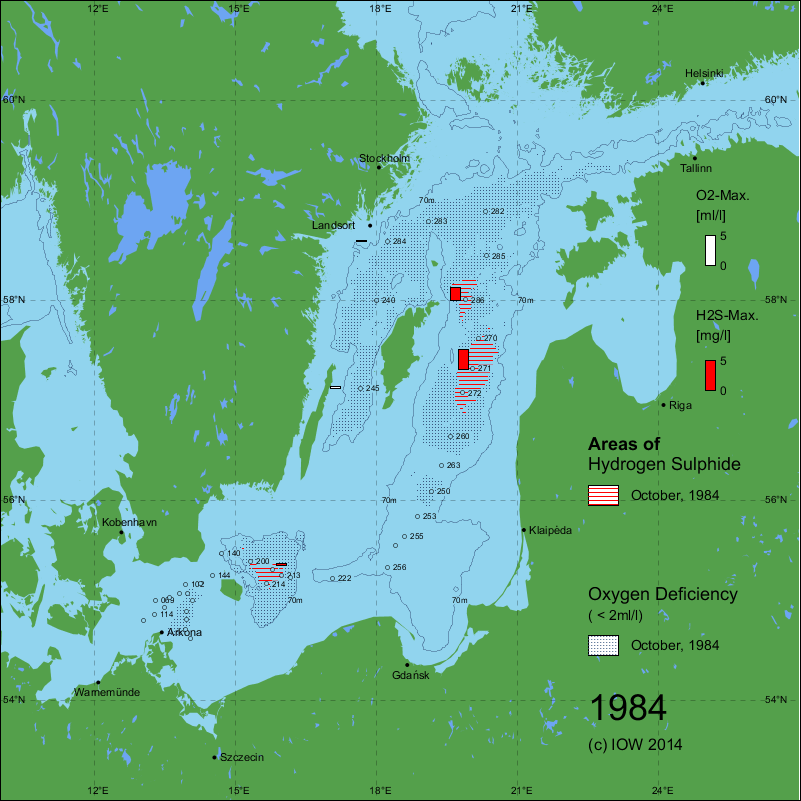
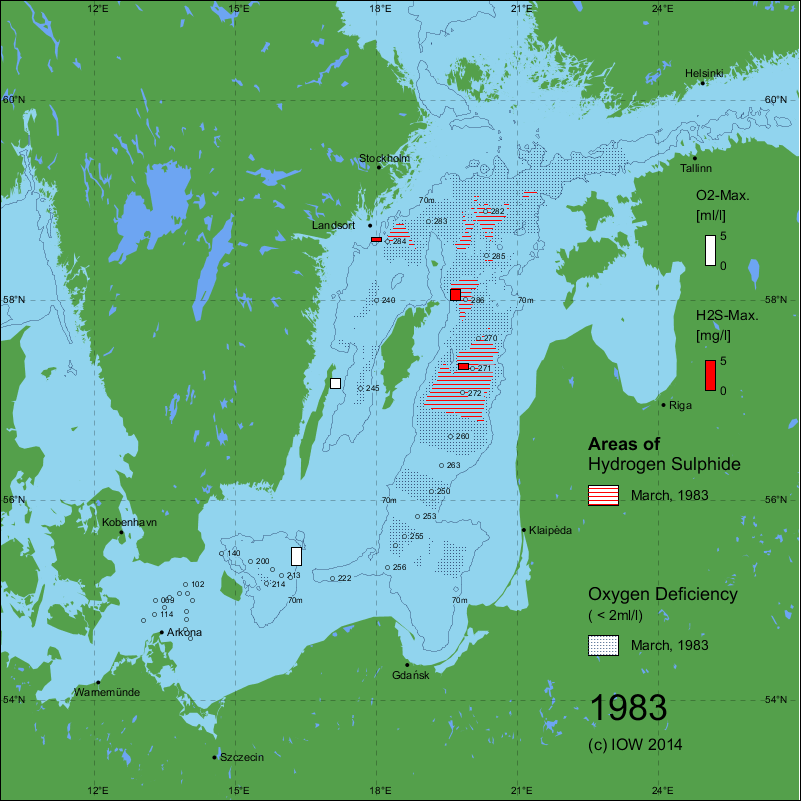
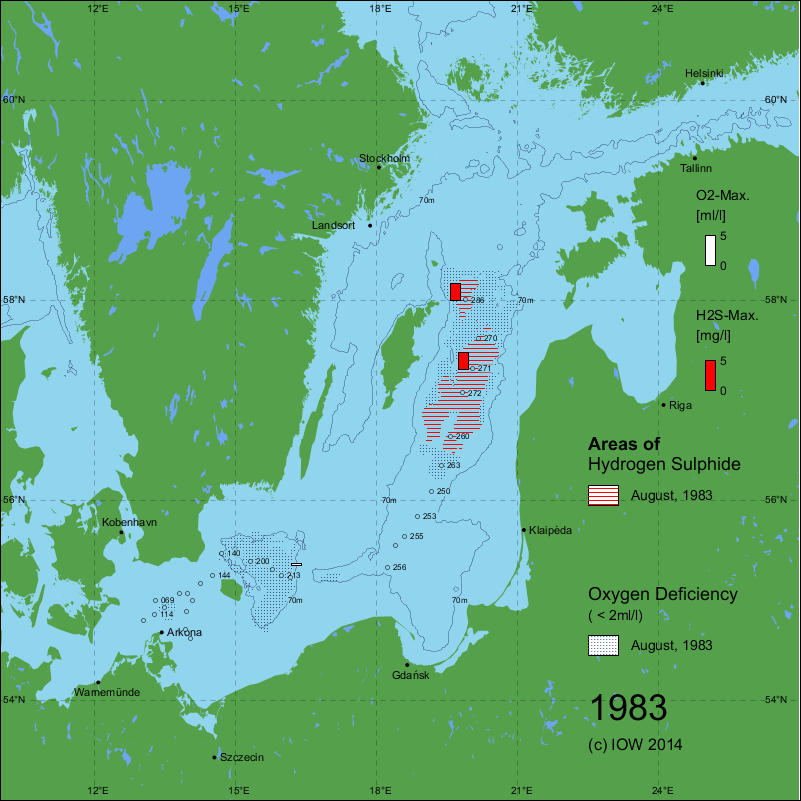
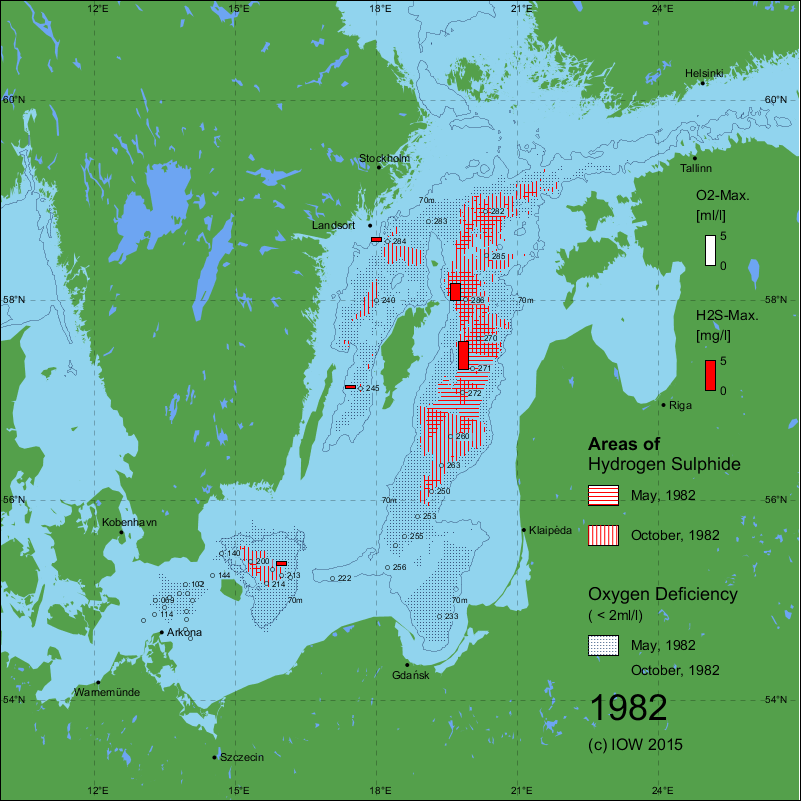
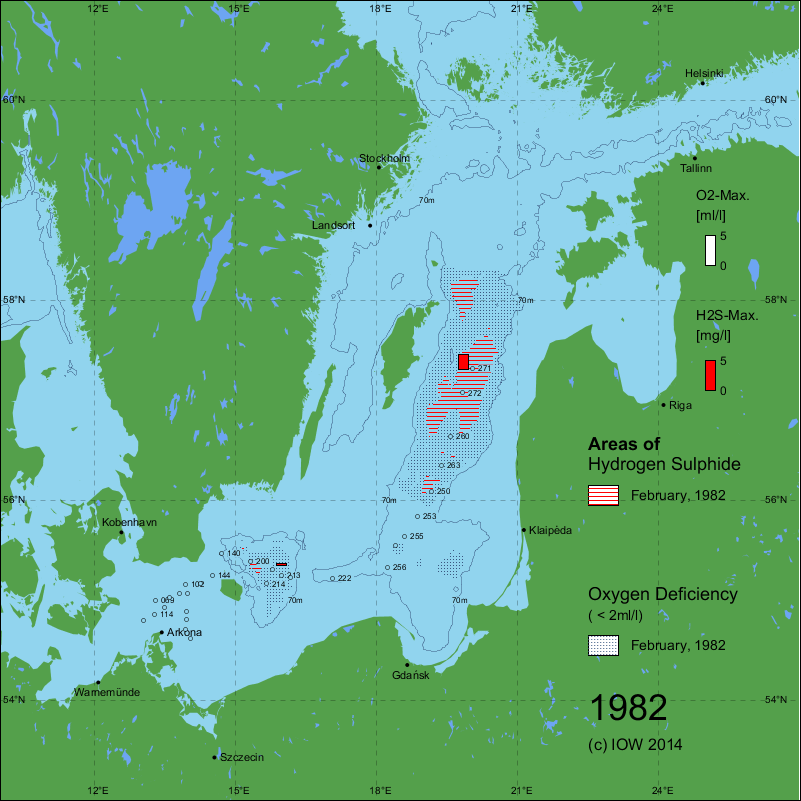
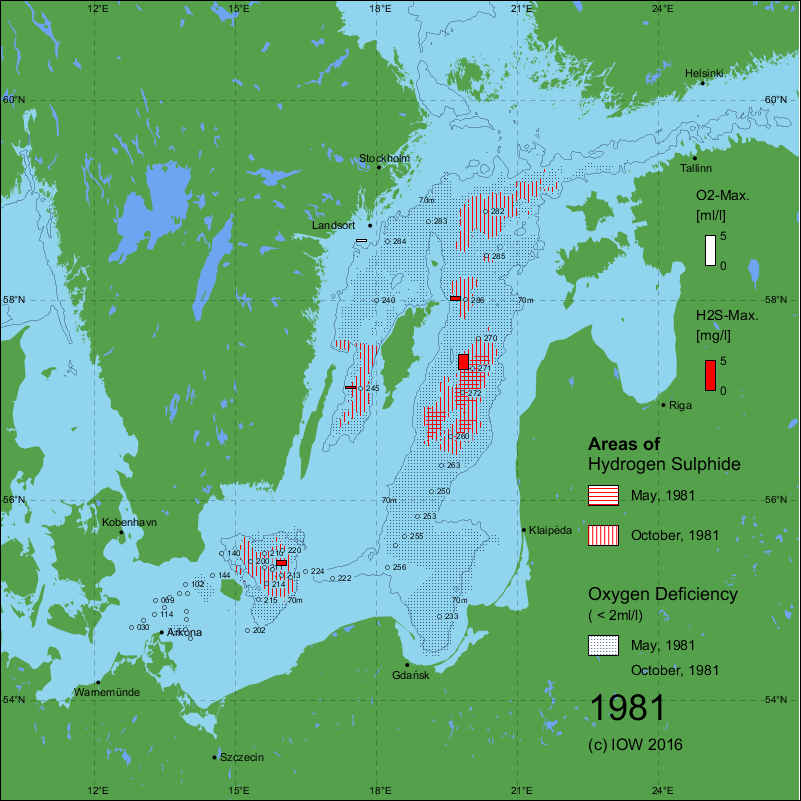
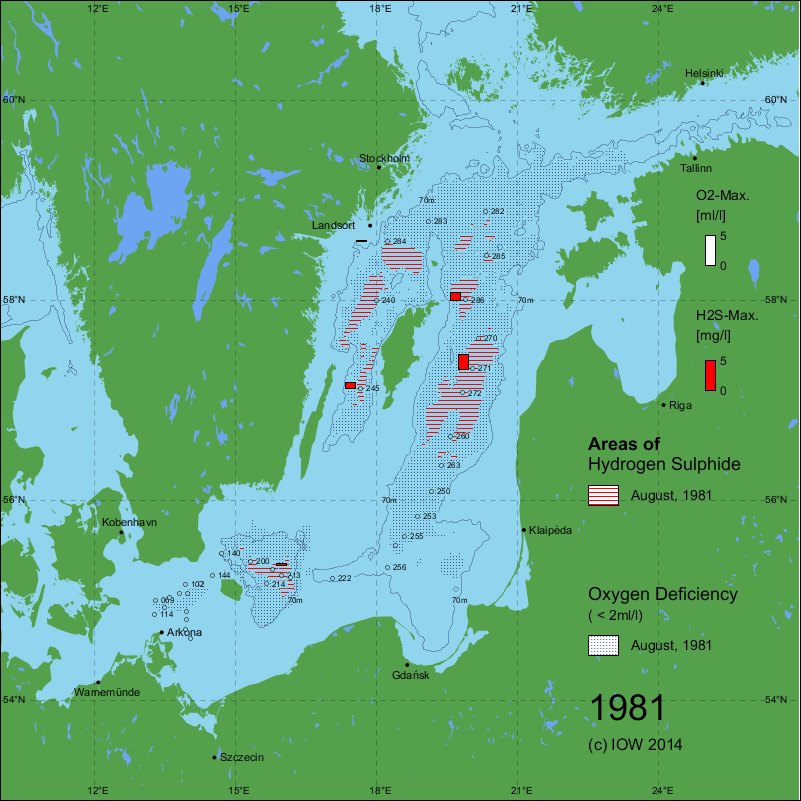
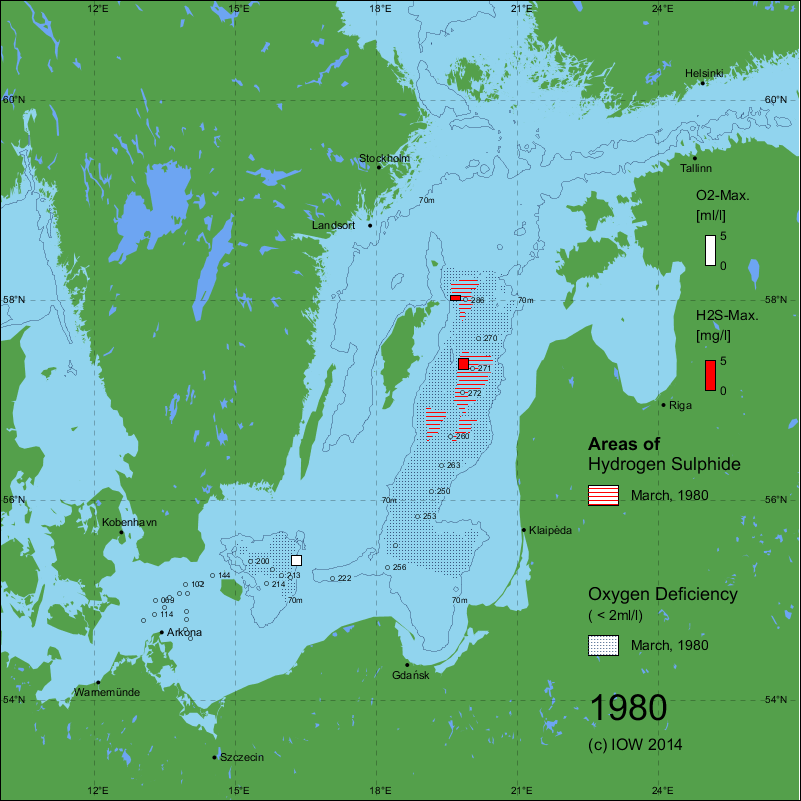
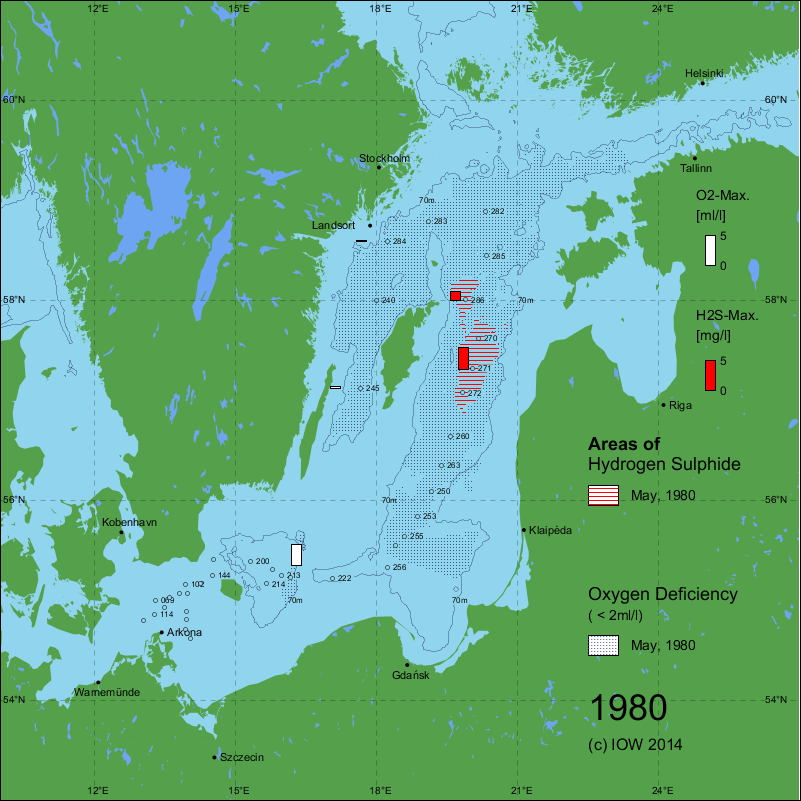
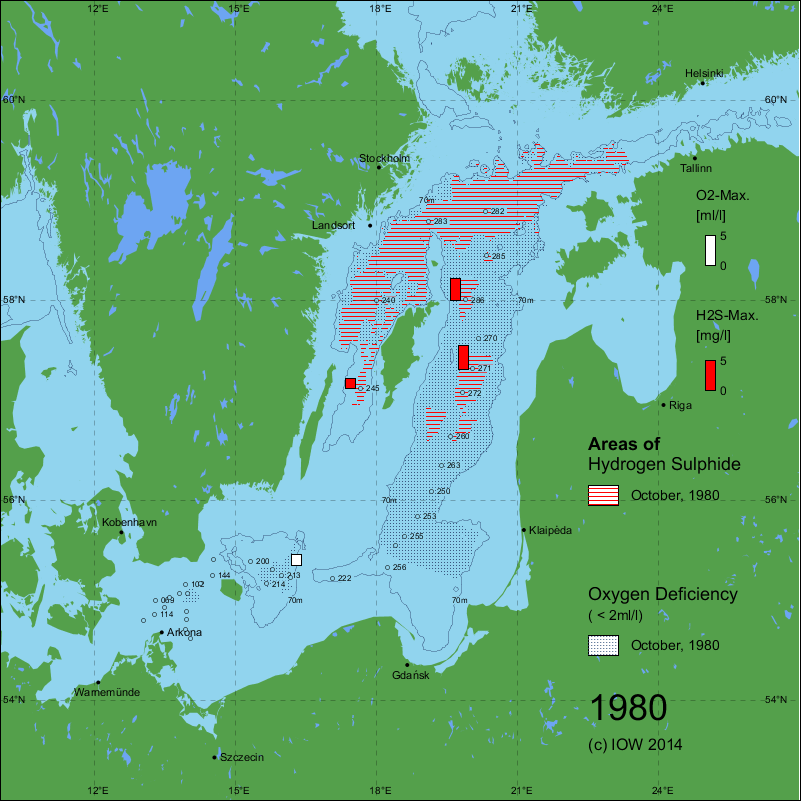
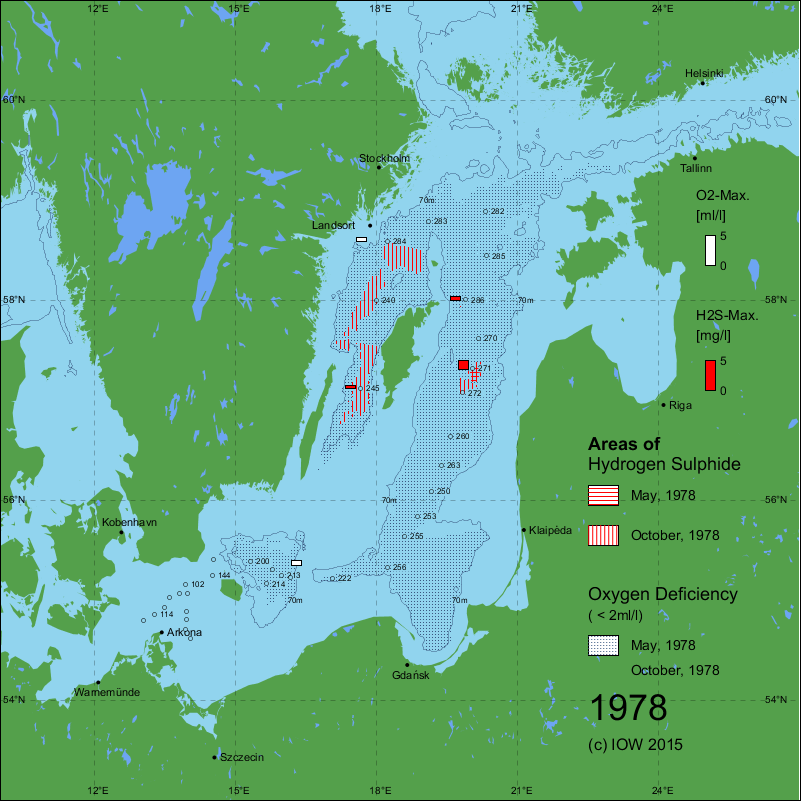
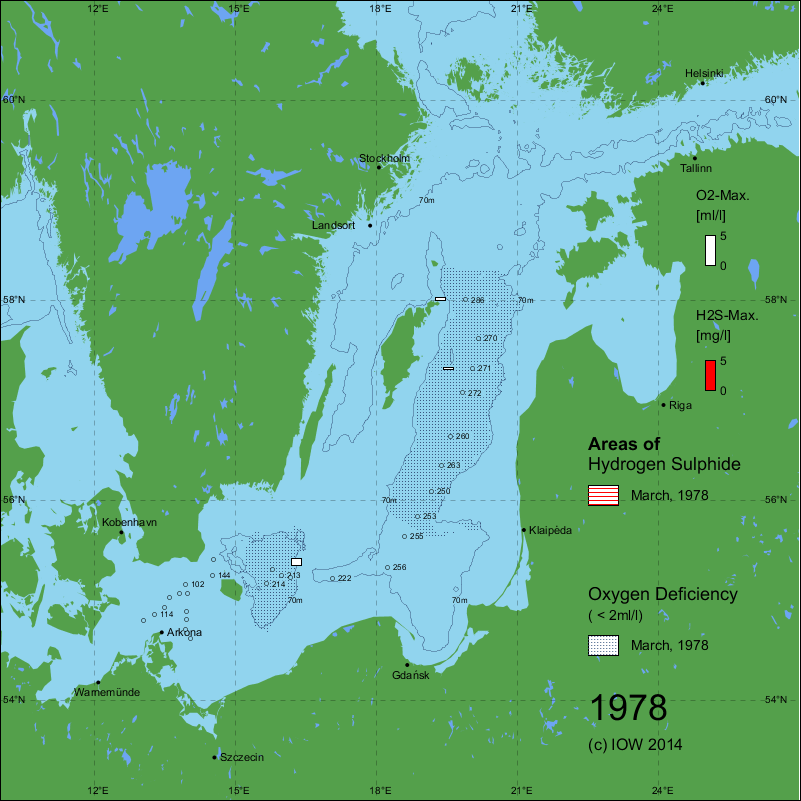
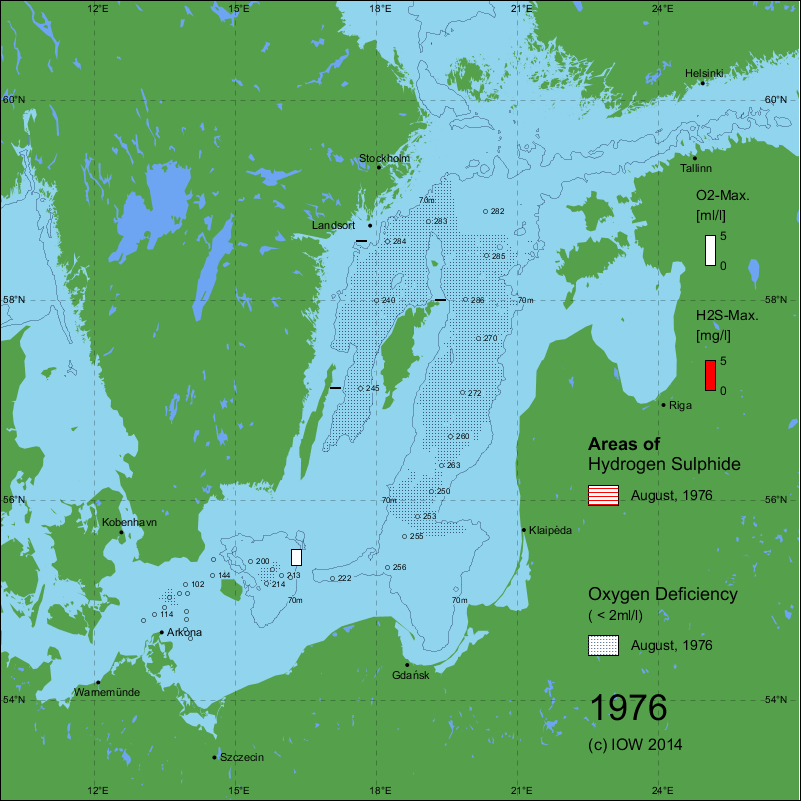
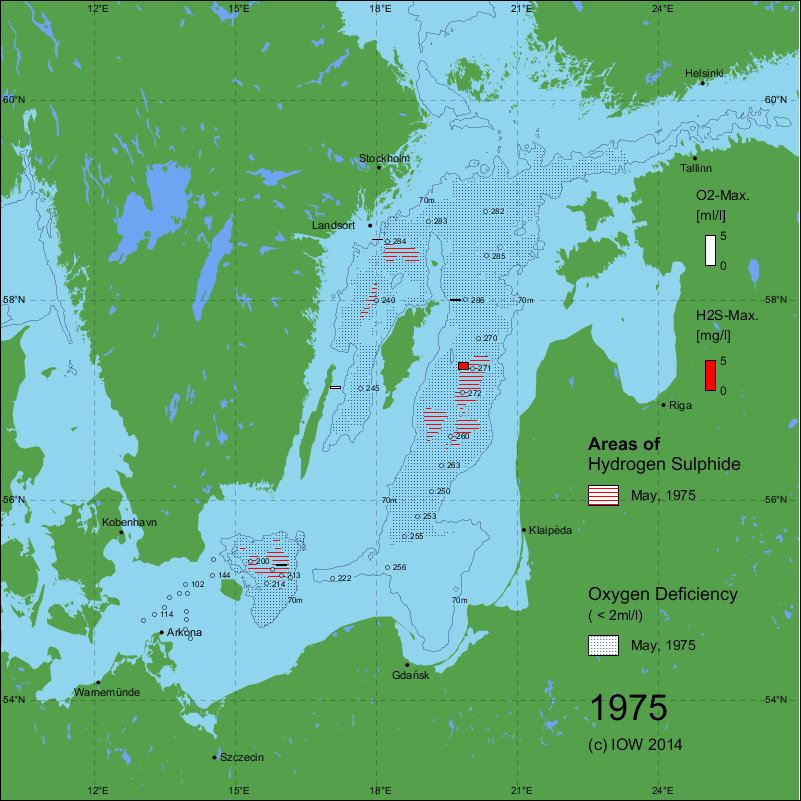
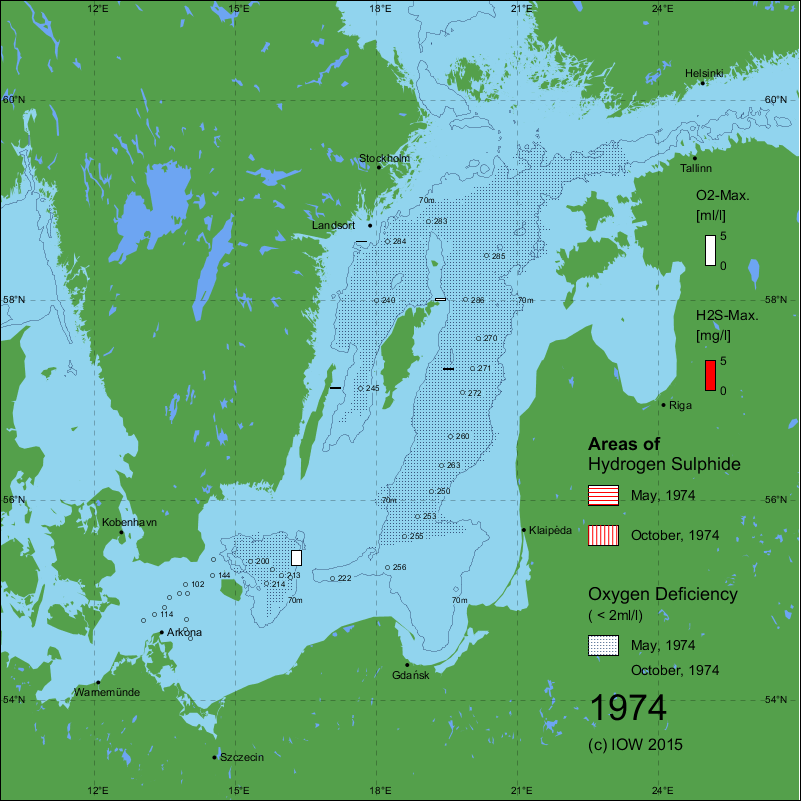
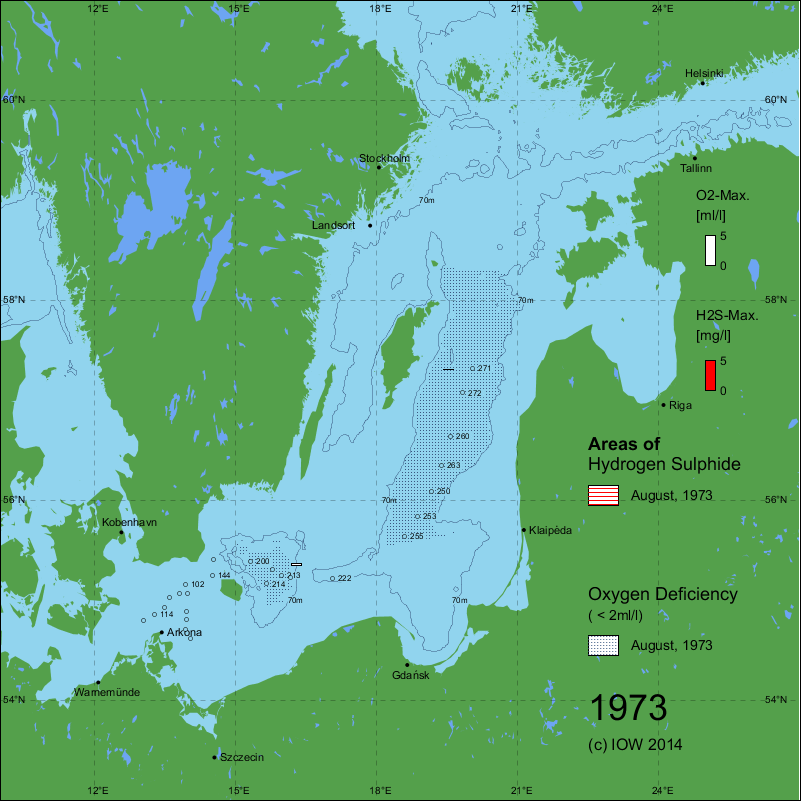
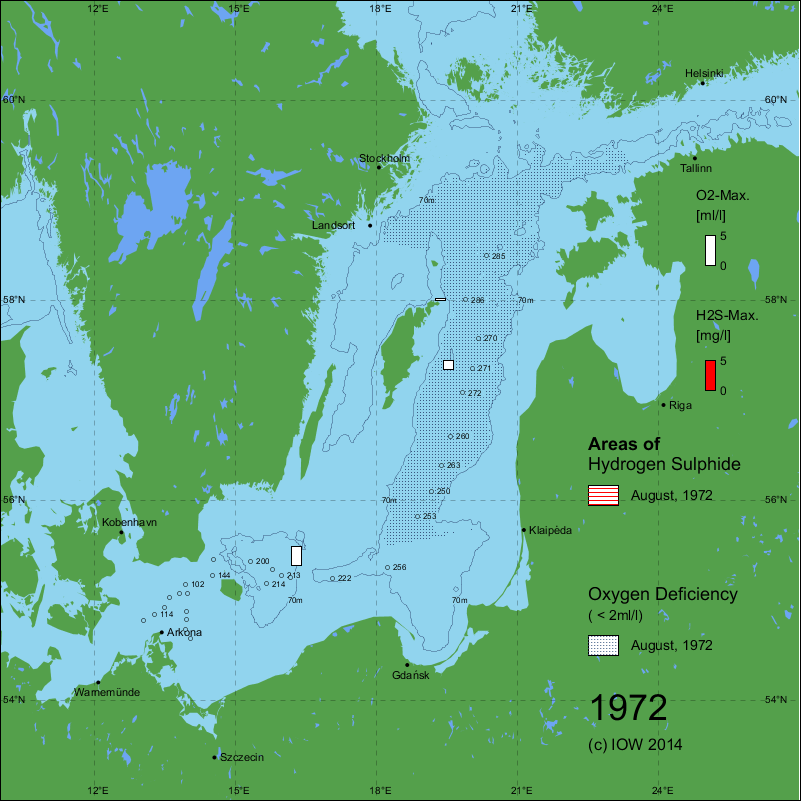
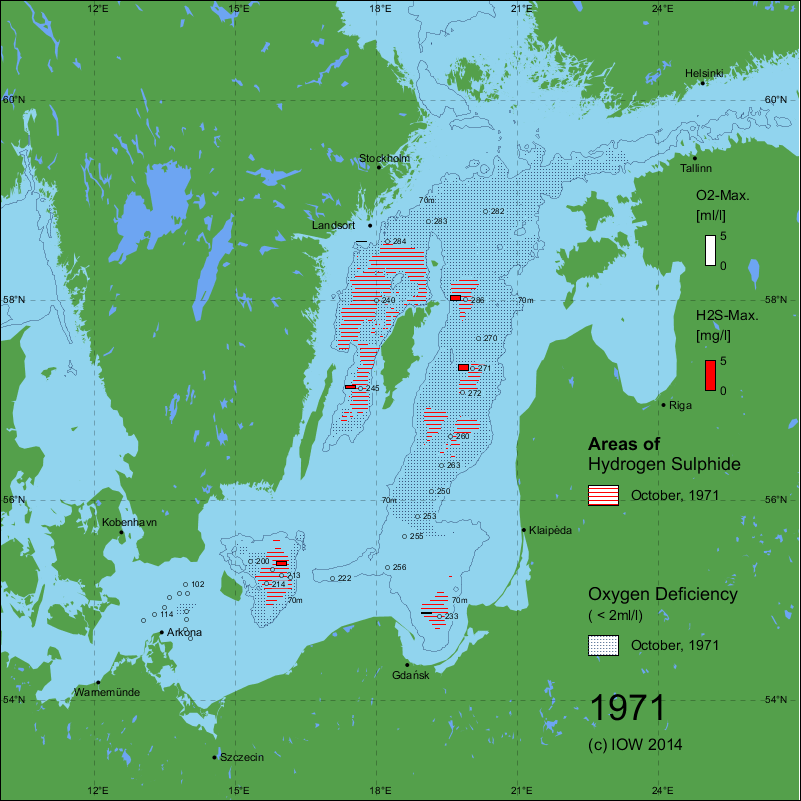
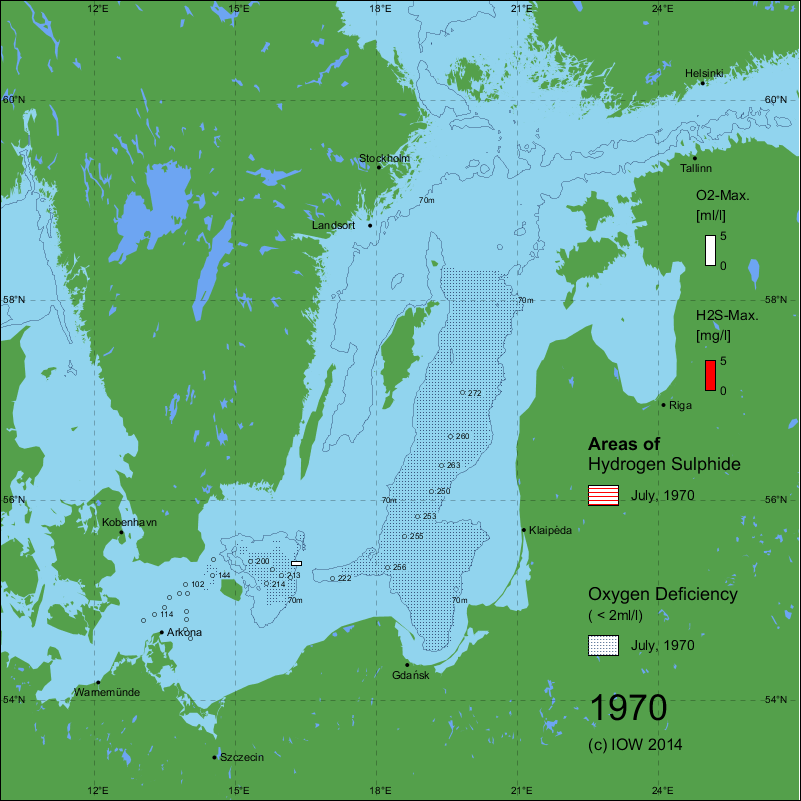
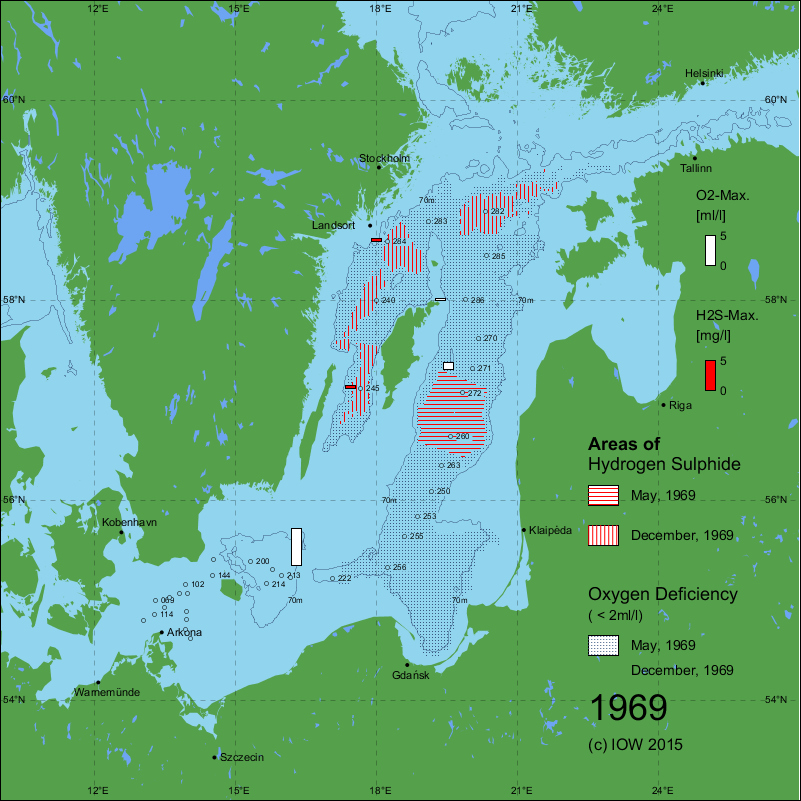
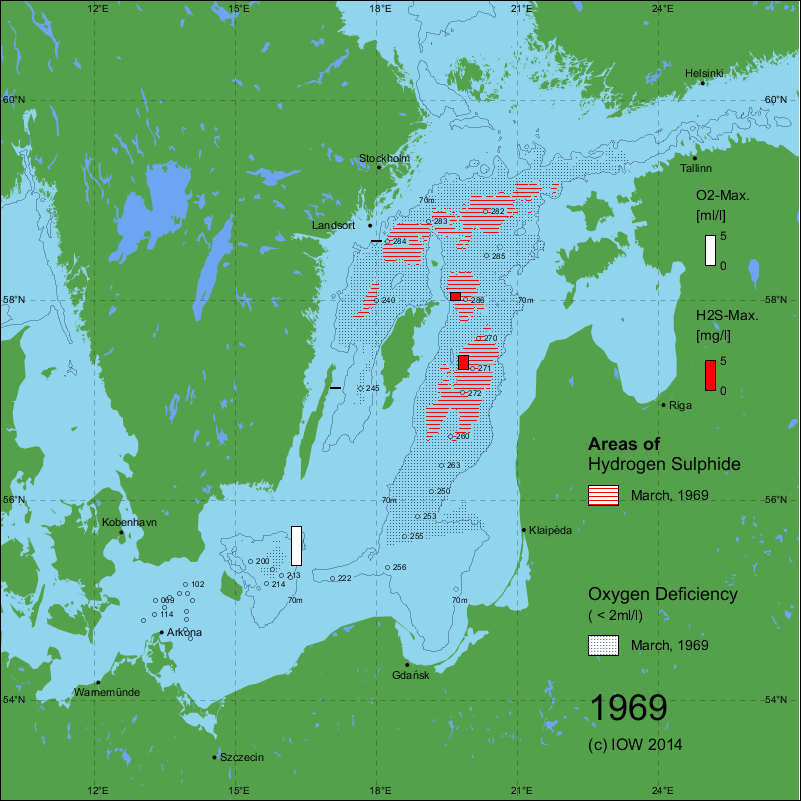
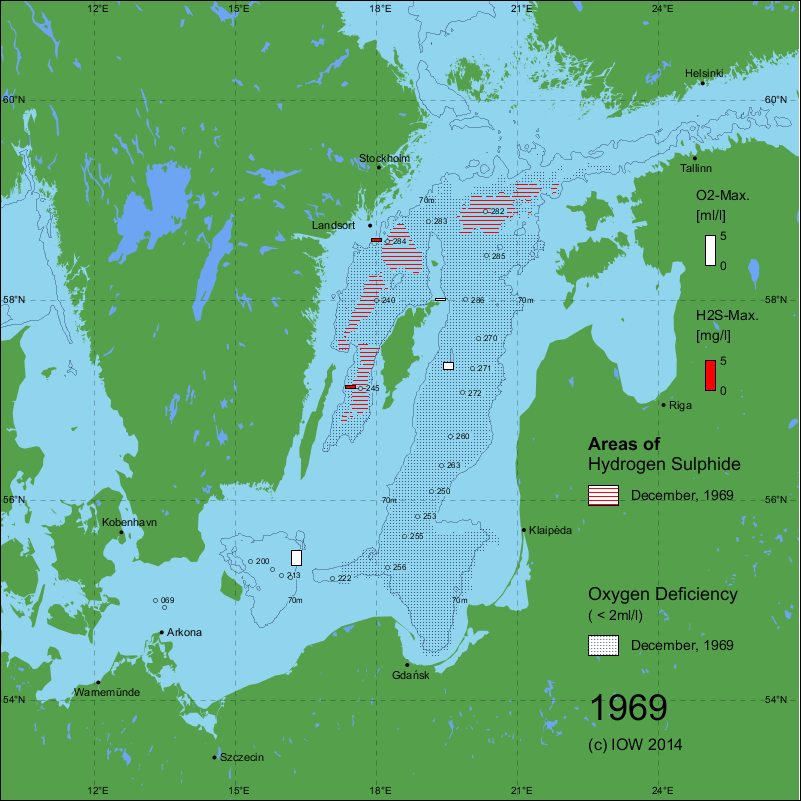
The graphs show the maximal areas of oxygen deficiency (<2 ml/l) and hydrogen sulphide in the near-bottom layer of the Baltic Sea in the last years. Histograms show the maximum oxygen resp. hydrogen sulphide concentrations in this layer for selected stations. Additionally, distribution patterns from special monitoring cruises (February, March/April, May, July/August, October/November) from 1969 onwards are shown.
Complete documentation in:
- Susanne Feistel, Rainer Feistel, Dietwart Nehring, Wolfgang Matthäus, Günther Nausch, Michael Naumann: Hypoxic and anoxic regions in the Baltic Sea, 1969 - 2015. Meereswiss. Ber., Warnemünde, 100 (2016) doi: 10.12754/msr-2016-0100
- mebe100_2016-hypoxic-and-anoxic-regions.pdf
- http://www.io-warnemuende.de/msr-2016-0100
2020 - 2029
| Jan/Feb | Mar/Apr | Apr/May | Jul/Aug | Oct/Nov | |
|---|---|---|---|---|---|
| 2022 | EMB286 | ||||
| 2021 | EMB256 | EMB261 | EMB264 | EMB271 | EMB280 |
| 2020 | EMB230 | EMB237 | EMB242 | EMB251 |
2010 - 2019
| Jan/Feb | Mar/Apr | Apr/May | Jul/Aug | Oct/Nov | |
|---|---|---|---|---|---|
| 2019 | EMB206 | EMB209 | EMB213 | EMB218 | EMB224 |
| 2018 | EMB175 | EMB179 | EMB182 | EMB190 | EMB199 |
| 2017 | EMB147 | EMB150 | EMB154 | EMB162 | EMB171 |
| 2016 | EMB120 | EMB124 | EMB128 | EMB135 | EMB143 |
| 2015 | EMB095 | EMB099 | EMB102 | M117 | EMB117 |
| 2014 | AL430 | AL433a | EMB069 | EMB078 | EMB089 |
| 2013 | AL407a | EMB040 | EMB045 | EMB053 | EMB060 |
| 2012 | 06AK1202 | 06EZ1203 | 06EZ1206 | 06EZ1213 | 06EZ1221 |
| 2011 | 06AK1101 | 06AK1102 | 06JX1101 | 06EZ1105 | 06EZ1112 |
| 2010 | 06HK1001 | 07PE1007 | 06HK1002 | 06AK1003 | 06HK1004 |
2000 - 2009
1990 - 1999
1980 - 1989
1970 - 1979
| Jan/Feb | Mar/Apr | Apr/May | Jul/Aug | Oct/Nov | |
|---|---|---|---|---|---|
| 1979 | * | * | * | 40/79/04 | 40/79/08 |
| 1978 | 40/78/01 | 40/78/02 | 40/78/03 | 40/78/05 | 40/78/08 |
| 1977 | * | 40/77/05 | 40/77/07 | 40/77/10 | 40/77/11 |
| 1976 | 40/76/03 | 40/76/05 | 40/76/07 | 40/76/08 | 40/76/11 |
| 1975 | 44/75/02 | 44/75/04 | 40/75/06 | 40/75/08 | 40/75/10 |
| 1974 | 44/74/02 | 44/74/04 | * | * | 40/74/10 |
| 1973 | * | 40/73/01 | 40/73/04 | 40/73/09 | 40/73/13 |
| 1972 | * | 40/72/03 | 40/72/05 | 40/72/09 | 40/73/13 |
| 1971 | 40/71/01 | 40/71/02 | 40/71/05 | 40/71/07 | 40/71/10 |
| 1970 | * | 40/70/02 | 40/70/04 | 40/70/05 | 40/70/07 |
1969
* No H2S map available due to lacking data from the central Baltic Sea
State of the Baltic Sea
- Annual Reports on the state of the Baltic Sea Environment
- Cruise Reports
- Data from the autonomous measuring stations
- Development of the suboxic and anoxic regions since 1969
- Baltic Thalweg transect since 2014
- Algal blooms at Heiligendamm since 1998
- "Major Baltic Inflow" December 2014
- "Major Baltic Inflow" January 2003
- Baltic saline barotropic inflows 1887 - 2018
- Further Reading
Current distribution pattern
