Optical nitrate measurement
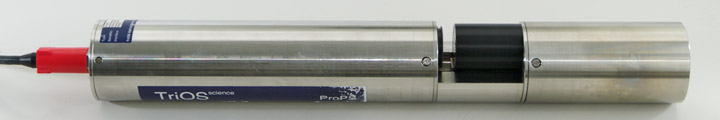
The project optical nitrate measurement is concerned with optimisation of the parameters for fitting absorption spectra measured in sea water to calibration spectra. While these optimisations should be of a general nature, for the measurements we use a ProPS instrument from the company TriOS.
Principle of optical nitrate determination
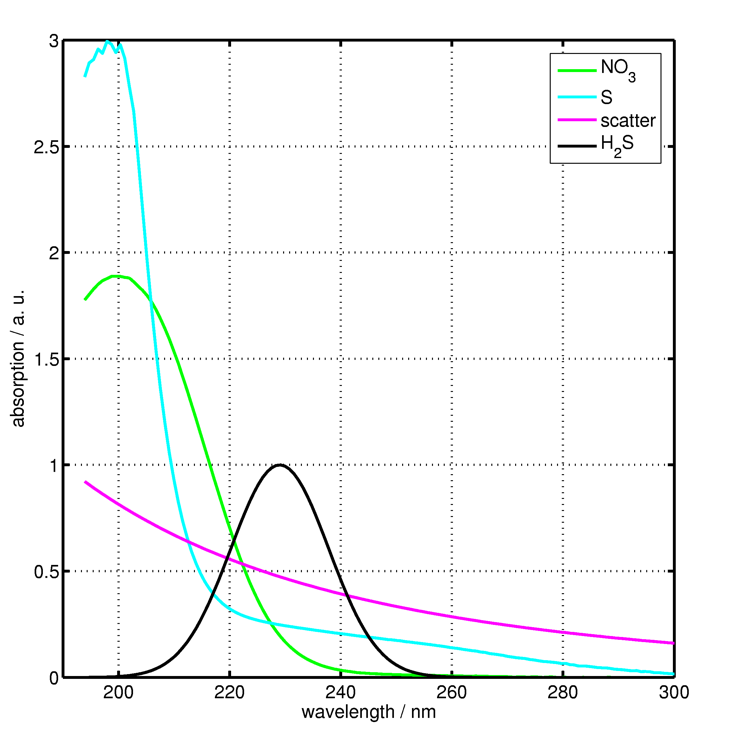
The absorption of nitrate, dissolved in water, in the ultraviolet (UV) region of the electromagnetic spectrum has long been known. For the determination of nitrate concentration in seawater using the absorption spectrum the contribution of the nitrate to the total absorption has to be identified. Since other constituents of seawater also absorp in the UV region of the spectrum (e.g. the salts, H2S, humic acid) the identification of the nitrate contribution to the absorption spectrum is not straight forward.
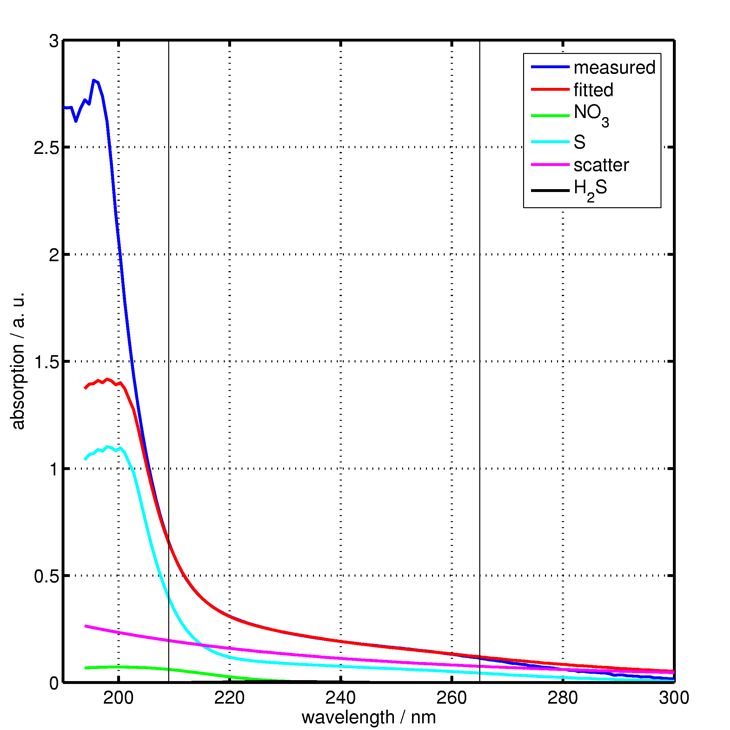
The absorption is measured at a range of wavelengths, then the resulting absorption spectrum is fitted to a linear combination of calibration spectra using a mathematical algorithm. The calibration spectra have been recorded previously in the laboratory by dissolving the individual contributors (e.g. salt, H2S, humic acid) in pure water and then taking absorption spectra of this solution.
The algorithm used for fitting the absorption spectra of the seawater samples to the calibration spectra, called multiple linear regression, has a number of parameters (e.g. range of wavelengths to fit, calibration spectra to include, admission of negative concentrations) that have to be optimised for the waters of the deployment region (in our case the Baltic Sea). To find the optimisation we are working together with the working group General Marine Chemistry, who are analysing the samples with standard wet chemical methods in the laboratory and are our 'gold standard'.
A comparison of results from optical absorption measurement (red) and laboratory measurements (blue) of nitrate and H2S concentrations can be seen in the following figures.
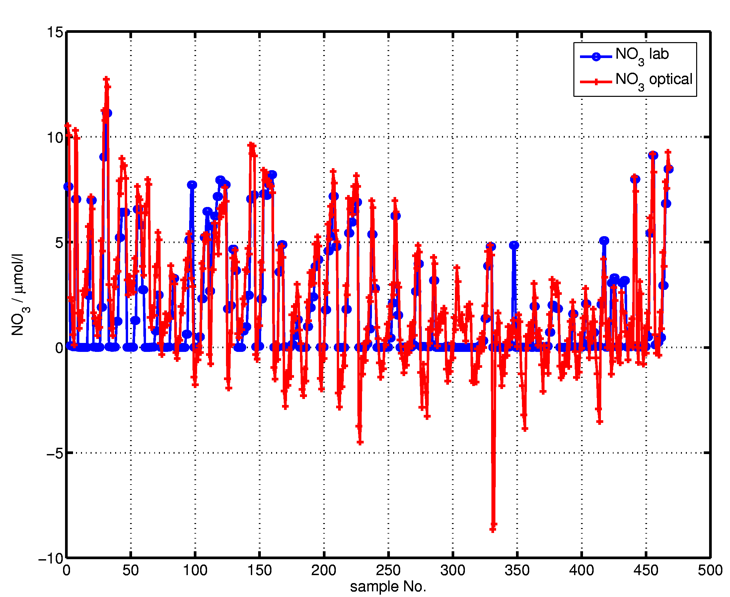
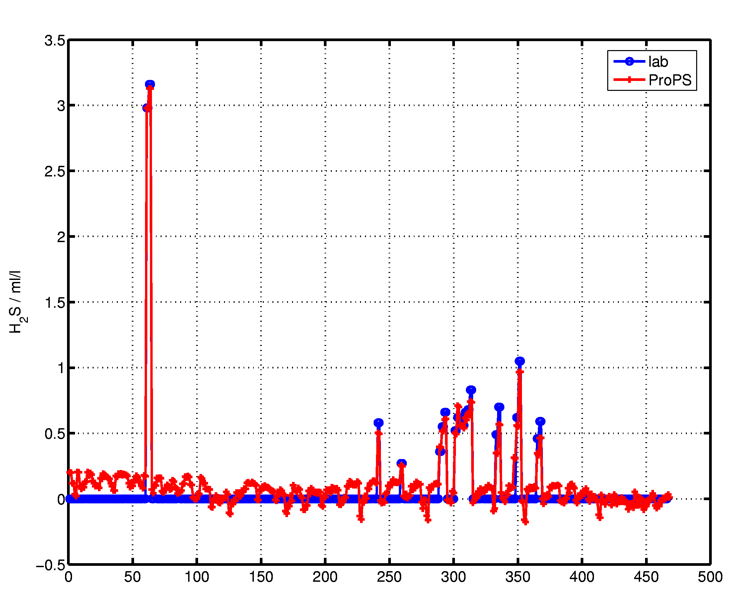
The H2S data from the optical measurement shows good agreement with the lab method for the (few) data points with H2S concentrations greater 0 in the lab values. The nitrate data show some severe differences in some data points, generally, however, the error is below 3 µmol/l.
The accuracy of the concentration values is not as good as the wet chemical laboratory methods. The main advantage of the optical method, however, is that measurements can be carried out rapidly and in situ. No reagent consumption also means that long term measurements are much easier to realize than with wet chemical in situ analysers.