
MeRamo: Unterstützung der mit der Umsetzung der EU Meeresstrategie-Rahmenrichtlinie befassten Behörden mittels eines assimilativen Ökosystemmodells
Projekt
Das Vorhaben verknüpft Copernicus Dienste und insbesondere Fernerkundungsdaten mit einem vorhersage- und szenarienfähigen Modellsystem, um die bestmögliche Informationsbasis zur Unterstützung der mit der Umsetzung der Europäischen Meeresstrategie-Rahmenrichtlinie (MSRL) befassten Behörden zu schaffen. Es werden die nötigen technischen Entwicklungen zur Verknüpfung von Fernerkundungsdaten, Modellsystem, Antriebsdaten und In-situ Daten durchgeführt, um zu einem einheitlichen Unterstützungssystem mit einheitlicher Ausgabe zu gelangen. Die verwendeten Fernerkundungsdaten werden hauptsächlich von den Sentinel-3 Satelliten stammen, die mit Hilfe der Datenassimilation in ein bestehendes gekoppeltes Zirkulations- und Ökosystemmodell integriert werden sollen. Dieses Modell wird Antriebsdaten verwenden, die insbesondere für die atmosphärische Deposition eine Unterscheidung nach unterschiedlichen Eintragsquellen (z.B. Schiffsemmissionen) möglich macht. Die Verfolgung dieser unterschiedlichen Einträge wird mit Hilfe eines zu implementierenden Nährstoff-Verfolgungs-Moduls im Ökosystemmodell gewährleistet werden. Allgemeinen Informationen zu MeRamo finden sich in der IOW Projektdatenbank [1].
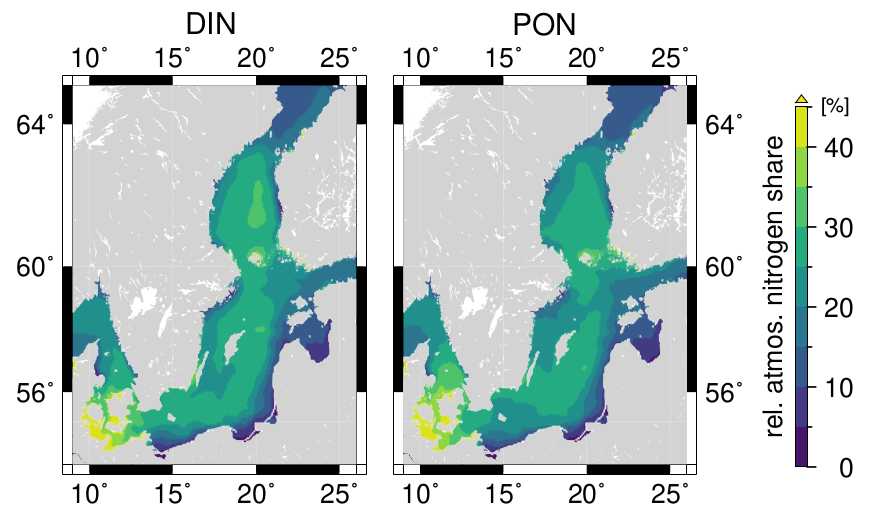
Abbildung 1: Beitrag atmosphärischer Stickstoffdeposition zu marinen DIN (dissolved inorganic nitrogen; gelöster anorganischer Stickstoff) und PON (particulate organic nitrogen; partikulärer organischer Stickstoff) Konzentrationen im Oberflächenwasser.
In MeRamo wurde der Anteil von Stickstoff aus atmosphärischer Deposition an unterschiedlichen marinen Stickstoffverbindungen mit Hilfe des gekoppelten physikalischen biogeochemischen Ozeanmodells HBM-ERGOM abgeschätzt und analysiert. Die Simulationen wurden auf Hochleistungsrechnern des HLRN (Norddeutsche Verbund für Hoch- und Höchstleistungsrechnen) durchgeführt [2]. Abbildung 1 zeigt einige Ergebnisse: der Anteil atmosphärischen Stickstoffs an DIN (links; dissolved inorganic nitrogen; gelöster anorganischer Stickstoff) und PON (rechts; particulate organic nitrogen; partikulärer organischer Stickstoff). Der Anteil ist in der westlichen Ostsee am höchsten, weil diese Region leewärts (in Windrichtung) von Gebieten mit hohen atmosphärischen Stickoxid- und Ammonikemission liegt. Genauere Details sind in Neumann et al. (2018) zu finden [3].
Links und Referenzen
- MeRamo Beschreibung in IOW Projektdatenbank: www.io-warnemuende.de/project/145/meramo.html
- MeRamo Rechenzeitprojekt, Norddeutsche Verbund für Hoch- und Höchstleistungsrechnen (HLRN, Projekt ID: mvk00054): zulassung.hlrn.de/kurzbeschreibungen/mvk00054.pdf
- Neumann, D.; Friedland, R.; Karl, M.; Radtke, H.; Matthias, V. [&] Neumann, T.. Importance of high resolution nitrogen deposition data for biogeochemical modeling in the western Baltic Sea and the contribution of the shipping sector. Ocean Sci. Discuss., 2018. doi: 10.5194/os-2018-71
Model experiments performed within MeRamo
Content only available in English.
Table of Content
- General Information
- Purpose of the Experiments
- Performed simulations
- Area and time coverage
- Specific information
- Derived Publications
- Contact and Questions
- References
General Information
Several simulations with HBM-ERGOM were performed within the MeRamo project. The focus of these simulations was to evaluate the impact of atmospheric nitrogen deposition on algae blooms and on the nitrogen budget in the surface layer of the North Sea and Baltic Sea.
HBM is not made for multi-annual model runs but for operational forcasts. Due to a few issues with respect to multi-year runs, we restored the physics to the initial conditions (init. cond.s after the spin-up) in the beginning of each year.
Further, we experianced issues with respect to declining silicate concentrations in the Baltic Sea leading to silicate limitation, which should not be the case in the Baltic Sea. The reason is unclear. As a shortcut, we restored the silicate concentrations in the beginning of each year. We provide the model results with and without annual silicate restarts. We suggest to use the data with annually restored silicate.
Purpose of the Experiments
The focus of these simulations was to evaluate the impact of atmospheric nitrogen deposition on algae blooms and on the nitrogen budget in the surface layer of the North Sea and Baltic Sea.
Three nitrogen deposition data sets were used. The intention of using three (instead of one) deposition data sets was to evaluate how sensitive the biogeochemical system reacts to different atmospheric nutrient forcings. The data sets originate from simulations of two atmospheric chemistry transport models and they have three different spatial resolutions.
Additionally, deposition of nitrogen from different atmospheric emissions sources was tagged in the ERGOM simulations to assess the contribution of these sectors to marine DIN and chl-a. Namely, agricultural- and shipping-related emissions were tagged.
Performed simulations
Several simulations were performed. These are as follows:
- 10 years simulation with default nitrogen deposition (CMAQ, 16x16 km2, hourly) and four tagged sources (total atmos, ship, agri, and river); silicate and physics were restored each year
- 5 years simulation (only year 2 available on THREDDS; == iteration 1) with default nitrogen deposition (CMAQ, 16x16 km2) and four tagged sources (total atmos, ship, agri, and river); physics were restored each year
- 2 years simulation (only year 2 available on THREDDS; == iteration 1) with EMEP nitrogen deposition (50x50 km2, hourly) and no tagged source
- 2 years simulation (only year 2 available on THREDDS; == iteration 1) with high-res CMAQ nitrogen deposition (CMAQ, 4x4 km2, hourly) and two tagged sources (ship and river)
The nitrogen deposition data sets are described further below.
In the simulations (a) and (b) not all four sources were tagged in one model run but each two runs were performed with each two sources tagged (ship + river in the one; total atmos + agri in the other).
The tagged sources are abbreviated above. The abbreviations mean:
- ship: nitrogen deposition from shipping emissions is tagged (calculated by subtracting the results of two simulations with and without shipping emissions)
- agri: nitrogen deposition from agricultural ammonia emissions is tagged (estimated: approximately 95% of ammonia emissions are from agricultural activities; we considered 95% of ammonia and ammonium deposition to be from agricultural activities; see Neumann et al. (2018c) for details)
- total atmos: the full atmospheric nitrogen deposition is tagged
- river: nitrogen from river Elbe inflow is tagged
Internally, the simulation runs were named by a upper case letter and a numeral digit (eine Ziffer/Zahlzeichen). The letter identified the simulation setup and the numeral digit identified the year. Abbreviations of simulations of the first year does not contain a numeral digits and their identification letter does not always equal the identification letter of years 2 and latter. The reason is that one year 1 simulation was followed by different kind of year 2 (and so on) simulations. The abbreviations are listed here because they appear in the processing scripts and in the configuration files.
- C: year 1 of simulations (a) and (b) with tagged river and ship nitrogen
- D: year 1 of simulations (a) and (b) with tagged atmos and agri nitrogen
- T1 to T9: years 2 to 10 of simulation (a) with tagged river and ship nitrogen
- V1 to V9: years 2 to 10 of simulation (a) with tagged atmos and agri nitrogen
- K1 to K4: years 2 to 5 of simulation (b) with tagged river and ship nitrogen
- M1 to M4: years 2 to 5 of simulation (b) with tagged atmos and agri nitrogen
- E and E1: years 1 and 2 of simulation (c)
- B: year 1 of simulation (d)
- R1: year 2 of simulation (d)
Area and time coverage
- regional model: HBM-ERGOM, North Sea and Baltic Sea covered
- initialisation time: three month in 2011
- first output time stamp: 01-01-2012
- last output time stamp: 30-12-2012
- hourly resolution data archived at HLRN Hannover/Goettingen (see further below)
- daily resolution data available via IOW THREDDS (see further below)
- each simulation ran 12 model hours and was restarted than
Specific information
Spezific namelist setup
- Same constants/parameters used in ERGOM for all simulations
- Namelists differ with respect to tagged tracers (bioparams.nml and nc_varnames.nml)
- Namelists differ with respect to nitrogen deposition data set (bioparams.nml)
- First simulation of first year (= first 12 hours) were initialized from binary restart file without tagged tracers (we got it from BSH; the model was said to be spun-up); in simulations with tagging we need to activate the option read_binary_notag. It forces ERGOM to read only un-colored tracers from the binary restart file and to set all colored tracers to zero.
Atmospheric forcing and open boundary conditions
- meteorology: DWD forcing; postprocessed for the BSH at the DWD (not default DWD meteo products)
- nitrogen deposition:
- CMAQ 16x16 km2 (from HZG) (most simulations): CMAQ atmospheric chemistry model, CCLM coastDat2 forcing, CMAQ run on 16x16 km2 horizontal resolution
- CMAQ 4x4 km2 (from HZG) (a few simulations): CMAQ atmospheric chemistry model, CCLM forcing by finer as coastDat2 and advanced resolved precipitation, CMAQ run on 4x4 km2 horizontal resolution
- EMEP 50x50 km2 (a few simulations): EMEP model, 50x50 km2 horizontal resolution
- phosphorus deposition: constant, 0.471 umol/m2/d = 5.33 mg/m2/a
- BC, Atlantic Ocean, Salinity and Temperature: climatological data according to Janssen et al. (1999) and Maar et al. (2011)
- BC, Atlantic Ocean, Biogeochemistry: climatological data based on World Ocean Atlas (WOA05) as described by Maar et al. (2011)
Known errors and shortcomings and corrections
- correction: the forcing of only one year was used for all simulations (also for simulations over two and more consecutive years); reason: the CMAQ nitrogen deposition was available for only one year; the BSH-DWD meteorology was available for only one year
- correction: silicate restored in each annual iteration (only in simulation set (a)); reason: silicate limitation in the Baltic Sea after some years (too less recovery or too low input)
- correction: physics restored in each annual iteration; reason: too strong vertical mixing in the central Baltic Sea
- issue (not correct): no DIN depletion in the German Bight in summer; reason: underestimated denitrification in the Wadden Sea
Explanation to item 1:
- It takes some hand work to generate a high-quality atmospheric emission data sets. Different source data sets are merged for this purpose. Unfortunately, the data format of some of these data sets does not remain constant over time. Therefore, it is not straight-forward to generate a ten-year emission data set of high spatial and temporal resolution.
- Theoretically, we could produce or own meteorology fields for HBM. I was told by colleagues at the BSH that the DWD processes their meteo data somehow before they give it to the BSH as HBM forcing. The data might be somehow bias-corrected or otherwise adapted for the usage with HBM. The format of the DWD data was not constant over time. Therefore, different scripts exist at BSH for different years to process the data. Unfortunately, the scripts are not well documented and I was adviced not to try it on myself. The DWD meteo data are archived at the BSH in the format, in which they arrive from DWD (not in the HBM input format). Hence, providing us five or ten years of HBM meteo forcing would have taken a lot of time of one BSH colleagues.
Configuration and code files
- namelist files: meramo_setups_namelists.zip
- short descriptions of setups: meramo_setups_short_description.zip
- ERGOM code: meramo_setups_code.zip
- code dev repository: please see internal PhyWiki
The simulations are abbreviated by a two-character combination consisting of a letter (A-Z) and a numeral digit (0-9). Please have a look into section Performed simulations to read about the meaning of these abbreviations.
Output variables
- biogeochemistry: see IOW THREDDS server (all variables available there)
Storage of the results
| Place of Storage | Path |
| PERM at HLRN | Yes, Hannover/Goettingen (/mvkdneum/mvk00054) |
| IOW Storage | /silod4/dneumann/00_permanent_data/published_data/MeRamo/online |
| THREDDS, internal | http://thredds.io-warnemuende.de:8080/thredds/meramo/catalog_meramo.html |
| THREDDS, external | https://thredds-iow.io-warnemuende.de/thredds/projects/meramo/catalog_meramo.html |
Storage locations of model code are given in section Configuration and Code files. The full compile-able model code is not provided because we are not allowed to use it outside of MeRamo without permission of DMI or BSH.
Processing of the results for storage
Please see internal PhyWiki
Derived data sets
none
Derived publications
- Neumann et al., 2018a, discussion paper, 10.5194/os-2018-71: used second year of simulations (b), (c), and (d)
- Neumann et al., 2018b, discussion paper, 10.5194/bg-2018-364: used first five years of simulation (a)
- Neumann et al., 2018c, discussion paper, 10.5194/bg-2018-365: used fifth year of simulation (a)
Contact and Questions
Responsible for simulations and evaluation: Daniel Neumann
References
- Janssen, F.; Schrum, C. & Backhaus, J. O. A climatological data set of temperature and salinity for the Baltic Sea and the North Sea Dtsch. Hydrogr. Z., 1999, 51, 5
- Maar, M.; M[ller, E. F.; Larsen, J.; Madsen, K. S.; Wan, Z.; She, J.; Jonasson, L. & Neumann, T. Ecosystem modelling across a salinity gradient from the North Sea to the Baltic Sea Ecol. Modell., 2011, 222, 1696 - 1711
- Neumann, D.; Friedland, R.; Karl, M.; Radtke, H.; Matthias, V. & Neumann, T.. Importance of high resolution nitrogen deposition data for biogeochemical modeling in the western Baltic Sea and the contribution of the shipping sector. Ocean Sci. Discuss., 2018. doi: 10.5194/os-2018-71
- Neumann, D.; Karl, M.; Radtke, H. & Neumann, T.. Evaluation of atmospheric nitrogen inputs into marine ecosystems of the North Sea and Baltic Sea -- part A: validation and time scales of nutrient accumulation. Biogeosciences Discuss. 2018.
- Neumann, D.; Radtke, H.; Karl, M. & Neumann, T.. Evaluation of atmospheric nitrogen inputs into marine ecosystems of the North Sea and Baltic Sea -- part B: contribution by shipping and agricultural emissions. Biogeosciences Discuss. 2018.